Before starting to read the article install the below npm modules.
Examples were run on node 14.0.0. If you are going to use another version then the result may look different. Example node version v12.14.0 the flame graph will look different.
# >= 8.11.1
npm install -g autocannon
npm install -g clinic
now that we have learned about autocannon from the previous part we can finally look into clinicjs.
In short, clinicjs is a tool for diagnosing nodejs performance issues.
The npm module includes three diagnostic types:
- Doctor
- used for diagnosing CPU usage, blocking garbage collection, event loop delay, and checking the number of active handlers in the app
- Flame
- used for measuring the time a function was on CPU and the amount of time a function is on the top of the stack.
- Bubbleprof
- used to observe async operations, group them, and measure how long they were re-running.
Doctor
now that we went over the basic modules let’s first check the most valuable diagnostic type of all of them which isdoctor.
In our example, we will create a server that will enable us to include text in our image. In short, we will make a meme generator 😛.
The server will be quite simple mostly we are going to use the core nodejs module except for the image processing, where we will use the module jimp.
The below code sample is the first implementation of our app. The app is quite simple we make a request to our server where we are providing
a text query to our request.
Example of query string and server:
http://localhost:8888/?title=to%20much%20time&aligned=middle
👇
// slow-server.js
const { createServer } = require("http");
const url = require("url");
const Jimp = require("jimp"); // https://github.com/oliver-moran/jimp
const path = require("path");
const { textAlign } = require("./util.js");

const PORT = 8888;

createServer((req, res) => {
  handler(req, res).catch(err => {
    res.statusCode = 404;
    return res.end(err.message);
  });
}).listen(PORT, () => {
  console.log(`Server listening on ${PORT}`);
});

const handler = async (req, res) => {
  if (req.url === "/") {
    return res.end("ok");
  }
  // retriving query string paramters
  const {
    title = "",
    aligned = "top",
    urlImage = "",
  } = url.parse(req.url, true).query || {};
  const image = await Jimp.read(
    urlImage ? urlImage : path.join(__dirname, "/content/brick.jpeg")
  );
  const font = await Jimp.loadFont(Jimp.FONT_SANS_64_WHITE);

  await image.print(
    font,
    0,
    0,
    {
      text: title,
      alignmentX: Jimp.HORIZONTAL_ALIGN_CENTER,
      alignmentY: textAlign(aligned),
    },
    image.getWidth(),
    image.getHeight()
  );
  // create image and sent it back to client
  const body = await image.getBufferAsync(Jimp.MIME_JPEG);
  res.end(body);
};
// util.js
const Jimp = require("jimp");
// helper function for setting position of text
const textAlign = aligned => {
  switch (aligned) {
    case "middle":
      return Jimp.VERTICAL_ALIGN_MIDDLE;
    case "bottom":
      return Jimp.VERTICAL_ALIGN_BOTTOM;
    default:
      return Jimp.VERTICAL_ALIGN_TOP;
  }
};

module.exports = {
  textAlign,
};
With our first version of our server setup let’s make our first test with doctor.
Clinicjs by default doesn’t include a benchmarking tool. So for that case, you can choose to use
wrkorautocannon. In our case, we will be usingautocannon. The reason for that is that the creators ofclinicjsandautocannonware created by the same team.
clinic doctor --autocannon [ -c 10 -d 10 'localhost:$PORT/?title=to%20much%20time&aligned=middle'] -- node ./slow-server.js
like in prev article -c stands for number of connection and -d stands for the duration of time the autocannon should send request to the server.
Now if everything went correctly then we should see the autocannon output in the terminal and a doctor report in the browser.
Server listening on 8888
Running 10s test @ http://localhost:8888/?title=to%20much%20time&aligned=middle
10 connections
┌─────────┬─────────┬─────────┬─────────┬─────────┬────────────┬───────────┬────────────┐
│ Stat │ 2.5% │ 50% │ 97.5% │ 99% │ Avg │ Stdev │ Max │
├─────────┼─────────┼─────────┼─────────┼─────────┼────────────┼───────────┼────────────┤
│ Latency │ 7701 ms │ 8302 ms │ 8860 ms │ 8860 ms │ 8517.71 ms │ 376.77 ms │ 8860.11 ms │
└─────────┴─────────┴─────────┴─────────┴─────────┴────────────┴───────────┴────────────┘
┌───────────┬─────┬──────┬─────┬─────────┬─────────┬─────────┬─────────┐
│ Stat │ 1% │ 2.5% │ 50% │ 97.5% │ Avg │ Stdev │ Min │
├───────────┼─────┼──────┼─────┼─────────┼─────────┼─────────┼─────────┤
│ Req/Sec │ 0 │ 0 │ 0 │ 9 │ 1 │ 2.69 │ 1 │
├───────────┼─────┼──────┼─────┼─────────┼─────────┼─────────┼─────────┤
│ Bytes/Sec │ 0 B │ 0 B │ 0 B │ 18.5 MB │ 2.06 MB │ 5.52 MB │ 2.06 MB │
└───────────┴─────┴──────┴─────┴─────────┴─────────┴─────────┴─────────┘
Req/Bytes counts sampled once per second.
10 requests in 10.07s, 20.6 MB read
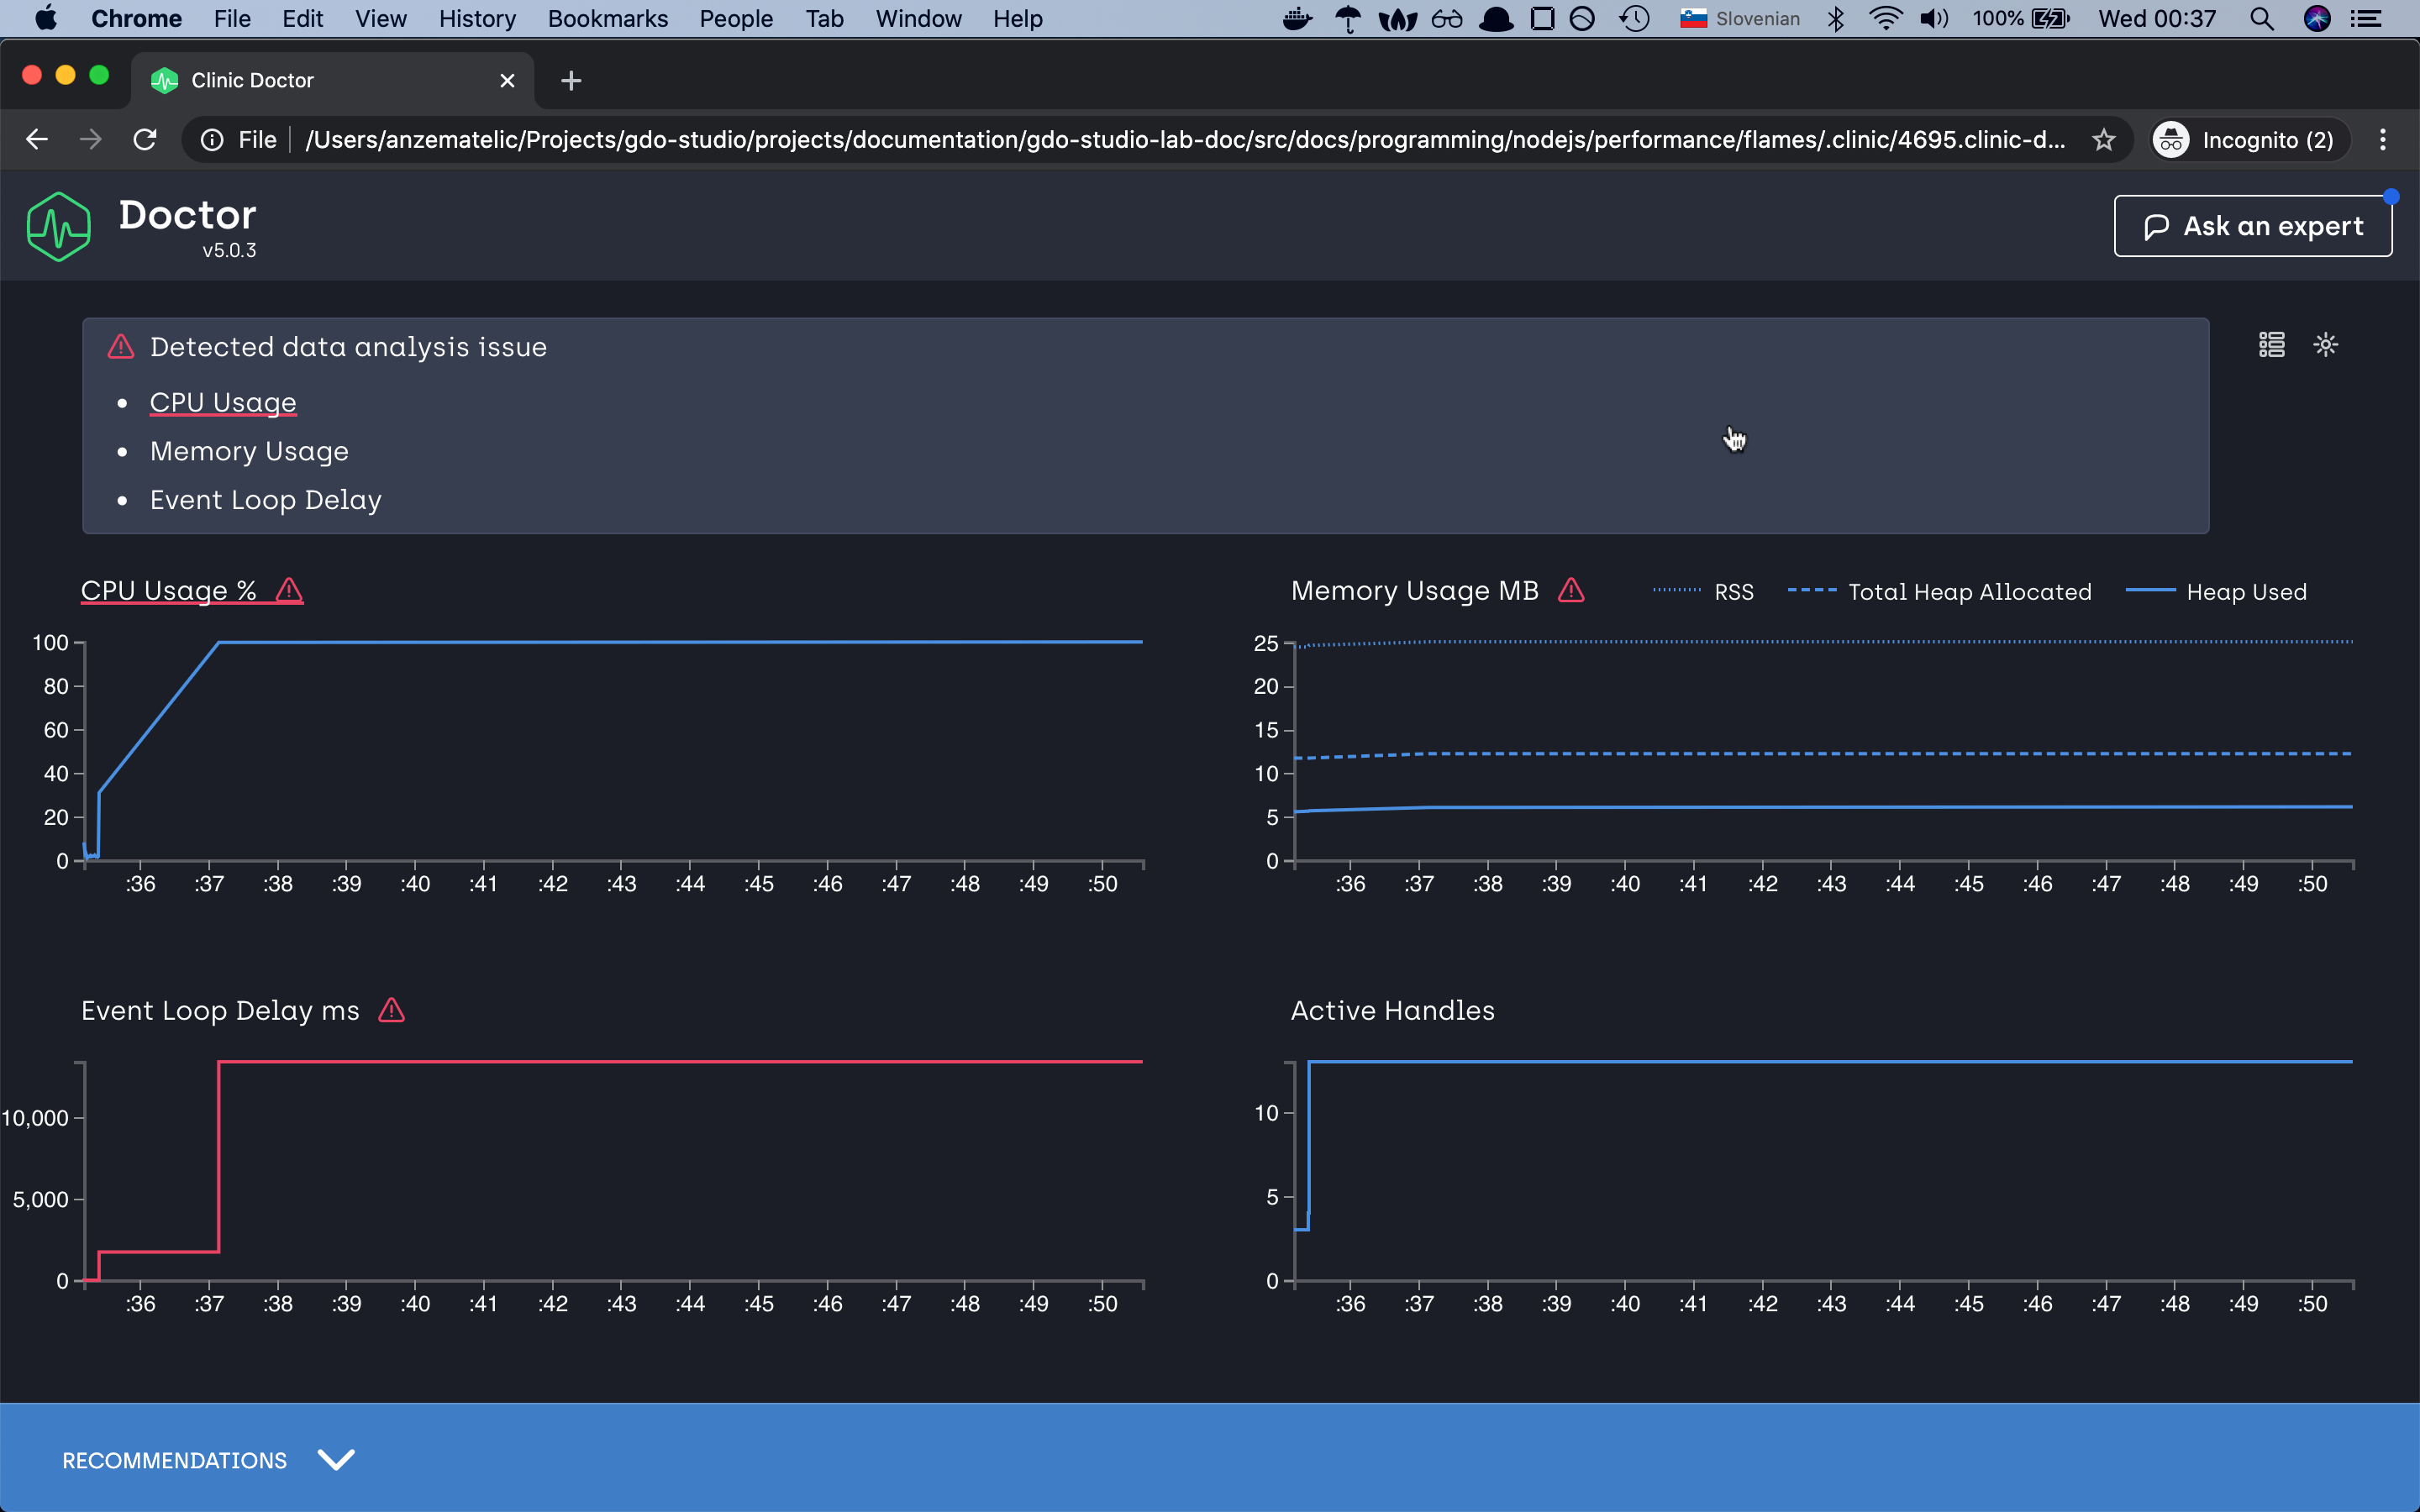
Analysing data
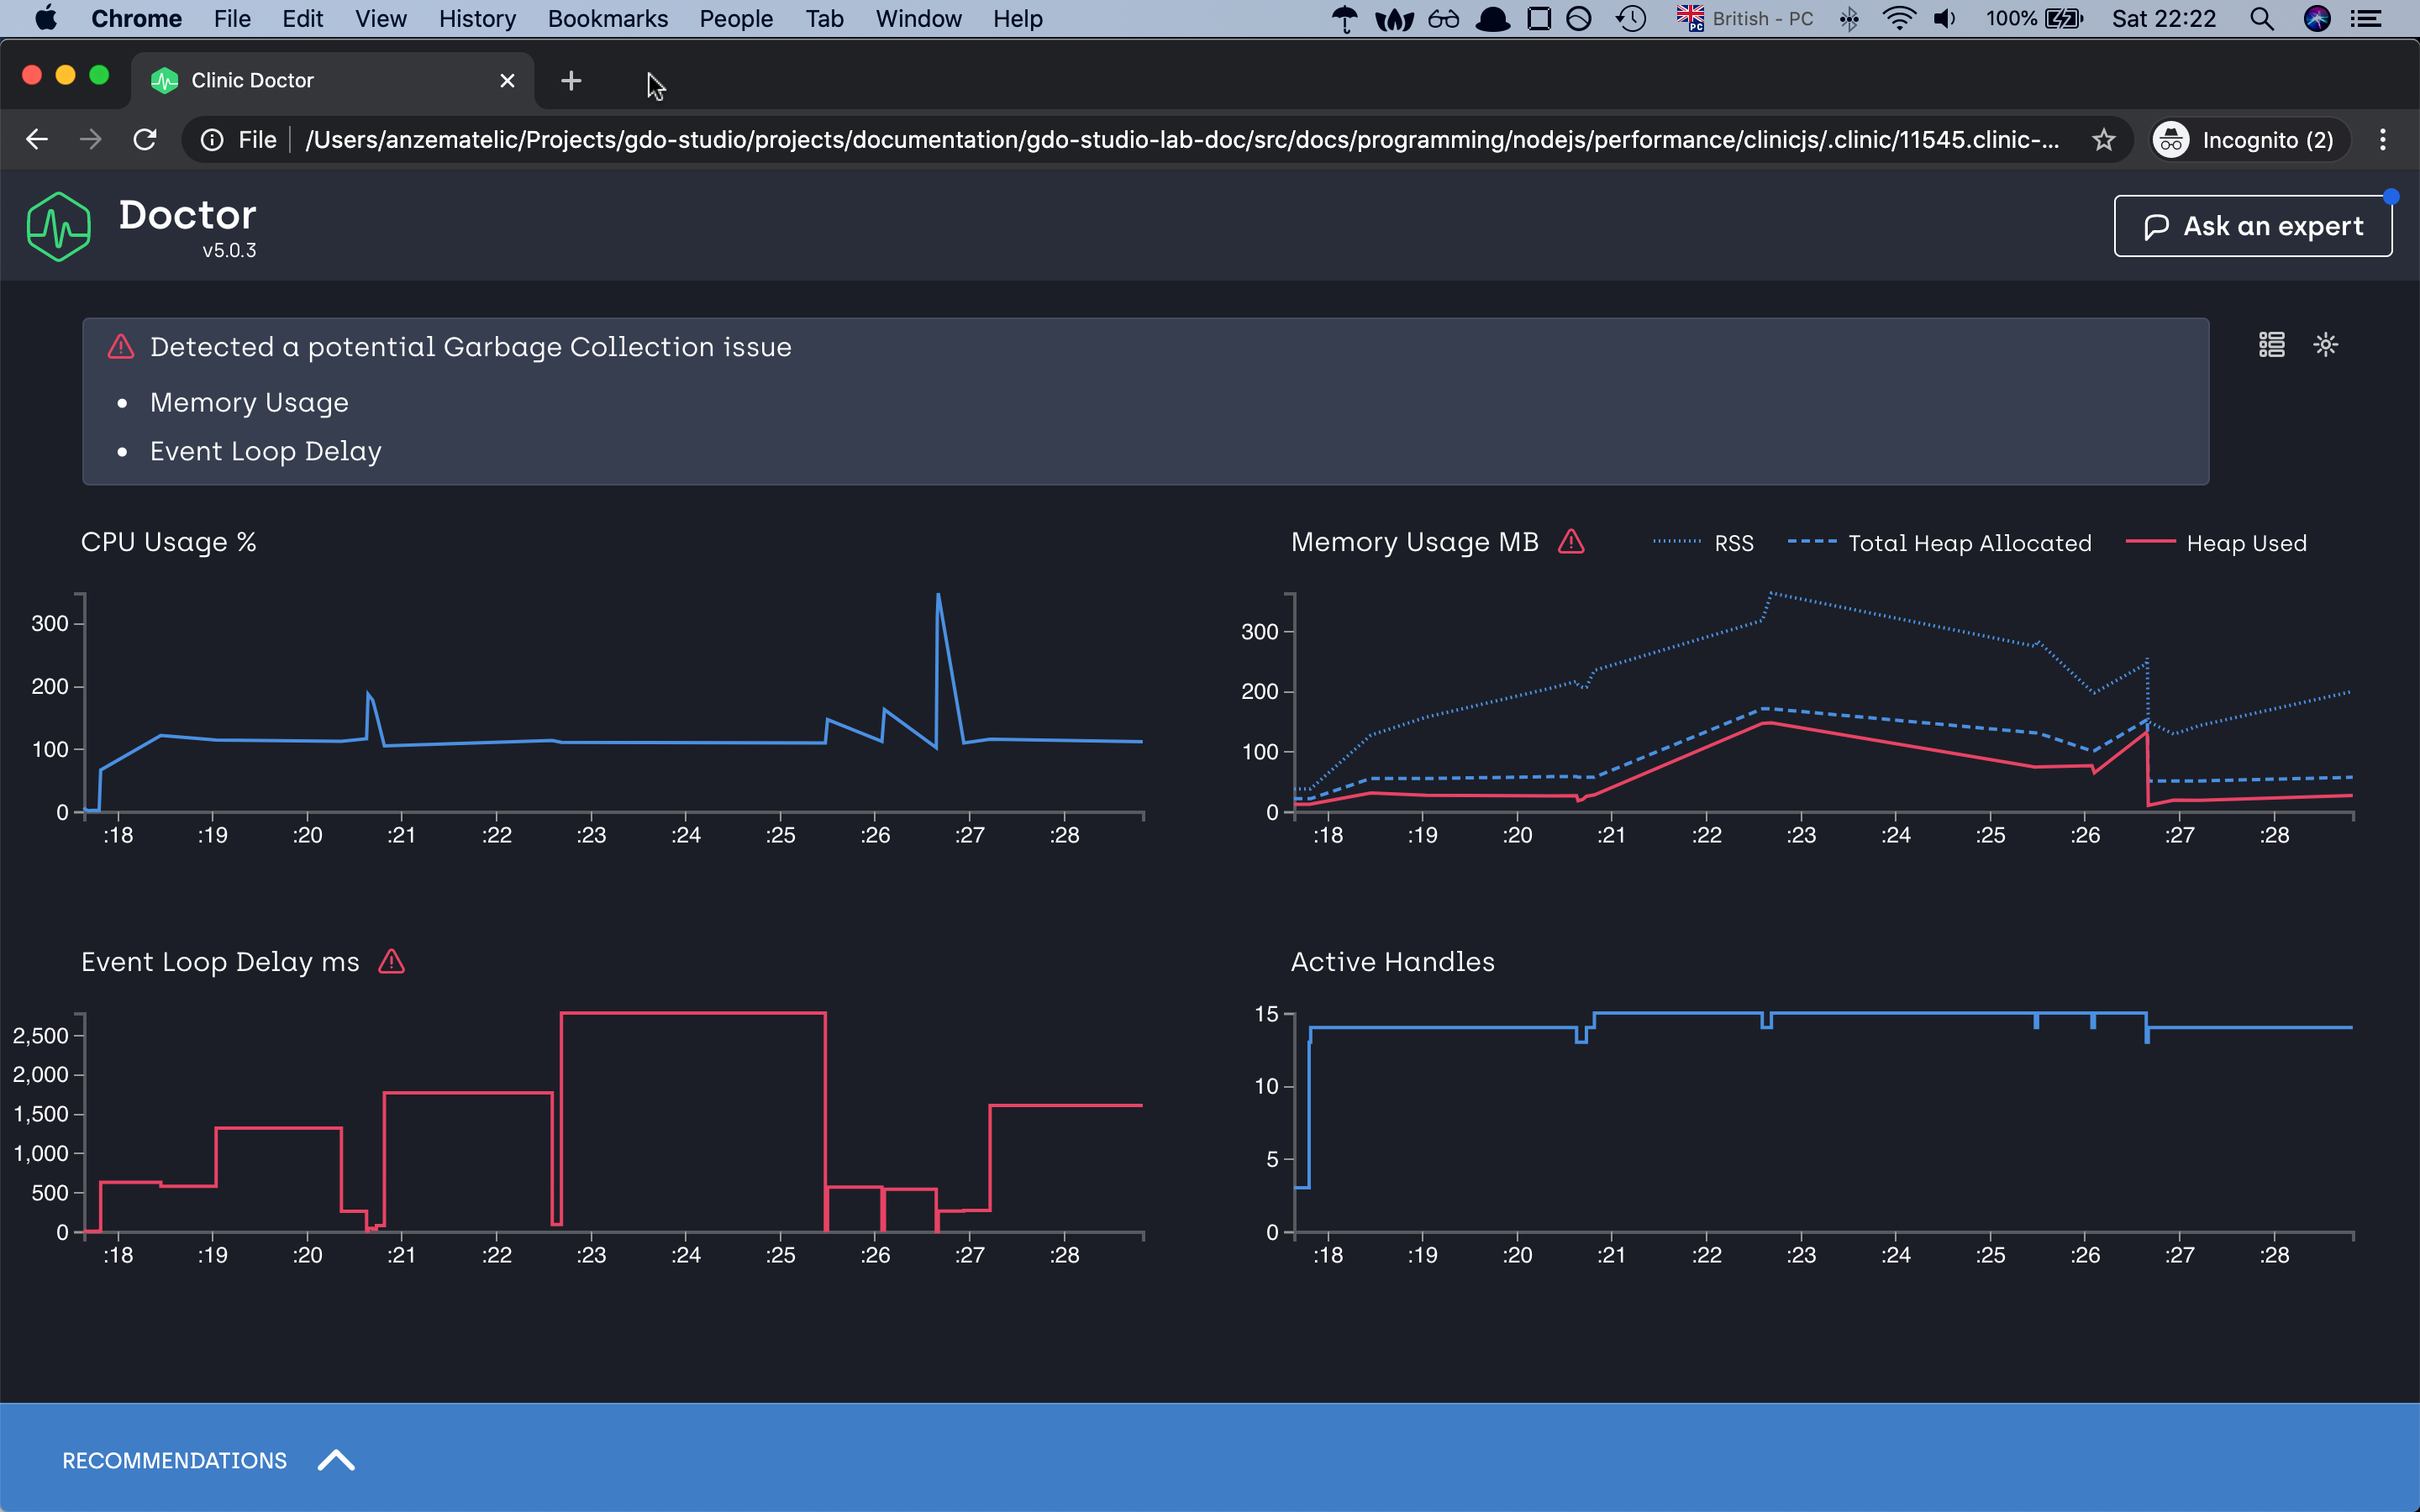
as we can see our application is taking a lot of time in the event loop task taking more than 2.5 seconds to complete if we loop at the y-axis, memory issue and the CPU is most of the time above 100%
let’s try to optimize our application and make it faster. For this, we will make a small change to our app. Rather than executing our image processing
in the main app, we will move all this code into another process. For this, we will use the spawn module from nodejs core and let’s see what will happen.
// fast-server.js
const { createServer } = require("http");
const url = require("url");
const Jimp = require("jimp");
const path = require("path");
const { textAlign } = require("./util.js");
const { finished } = require("stream");
var spawn = require("child_process").spawn;

const PORT = 8888;

async function main() {
  const font = await Jimp.loadFont(Jimp.FONT_SANS_64_WHITE);

  createServer((req, res) => {
    handler(req, res, font).catch(err => {
      res.statusCode = 404;
      return res.end(err.message);
    });
  }).listen(PORT, () => {
    console.log(`Server listening on ${PORT}`);
  });
}

var spawn = require("child_process").spawn;

const handler = async (req, res, font) => {
  const {
    title = "",
    aligned = "top",
    urlImage = "",
  } = url.parse(req.url, true).query || {};
  // default image if not image is provided
  const pt = urlImage ? urlImage : path.join(__dirname, "/content/brick.jpeg");
  // create new seperate process
  let command = spawn("node", ["./process.js", title, textAlign(aligned), pt]);

  finished(command.stdout.pipe(res), err => {
    if (err) return res.end("error");
  });
};

main();
// process.js
const url = require("url");
const Jimp = require("jimp");
const path = require("path");

async function main() {
  const [title, aligment, urlImage] = process.argv.slice(2);
  // console.log(title, aligment, image);
  const image = await Jimp.read(
    urlImage ? urlImage : path.join(__dirname, "/content/brick.jpeg")
  );
  const font = await Jimp.loadFont(Jimp.FONT_SANS_64_WHITE);
  await image.print(
    font,
    0,
    0,
    {
      text: title,
      alignmentX: Jimp.HORIZONTAL_ALIGN_CENTER,
      alignmentY: Jimp.VERTICAL_ALIGN_MIDDLE,
    },
    image.getWidth(),
    image.getHeight()
  );

  const body = await image.getBufferAsync(Jimp.MIME_JPEG);
  process.stdout.write(body);
}

main().catch(err => {
  console.log(err);
});
now let’s repeat the same command with the new improved script and let’s see the results.
Server listening on 8888
Running 10s test @ http://localhost:8888/?title=to%20much%20time&aligned=middle
10 connections

┌─────────┬─────────┬─────────┬─────────┬─────────┬───────────┬───────────┬────────────┐
│ Stat    │ 2.5%    │ 50%     │ 97.5%   │ 99%     │ Avg       │ Stdev     │ Max        │
├─────────┼─────────┼─────────┼─────────┼─────────┼───────────┼───────────┼────────────┤
│ Latency │ 3937 ms │ 4222 ms │ 4628 ms │ 4628 ms │ 4287.7 ms │ 234.01 ms │ 4628.72 ms │
└─────────┴─────────┴─────────┴─────────┴─────────┴───────────┴───────────┴────────────┘
┌───────────┬─────┬──────┬─────┬─────────┬─────────┬─────────┬─────────┐
│ Stat      │ 1%  │ 2.5% │ 50% │ 97.5%   │ Avg     │ Stdev   │ Min     │
├───────────┼─────┼──────┼─────┼─────────┼─────────┼─────────┼─────────┤
│ Req/Sec   │ 0   │ 0    │ 0   │ 10      │ 2       │ 3.58    │ 2       │
├───────────┼─────┼──────┼─────┼─────────┼─────────┼─────────┼─────────┤
│ Bytes/Sec │ 0 B │ 0 B  │ 0 B │ 20.6 MB │ 4.12 MB │ 7.36 MB │ 4.12 MB │
└───────────┴─────┴──────┴─────┴─────────┴─────────┴─────────┴─────────┘

Req/Bytes counts sampled once per second.

20 requests in 10.09s, 41.2 MB read
Analysing data
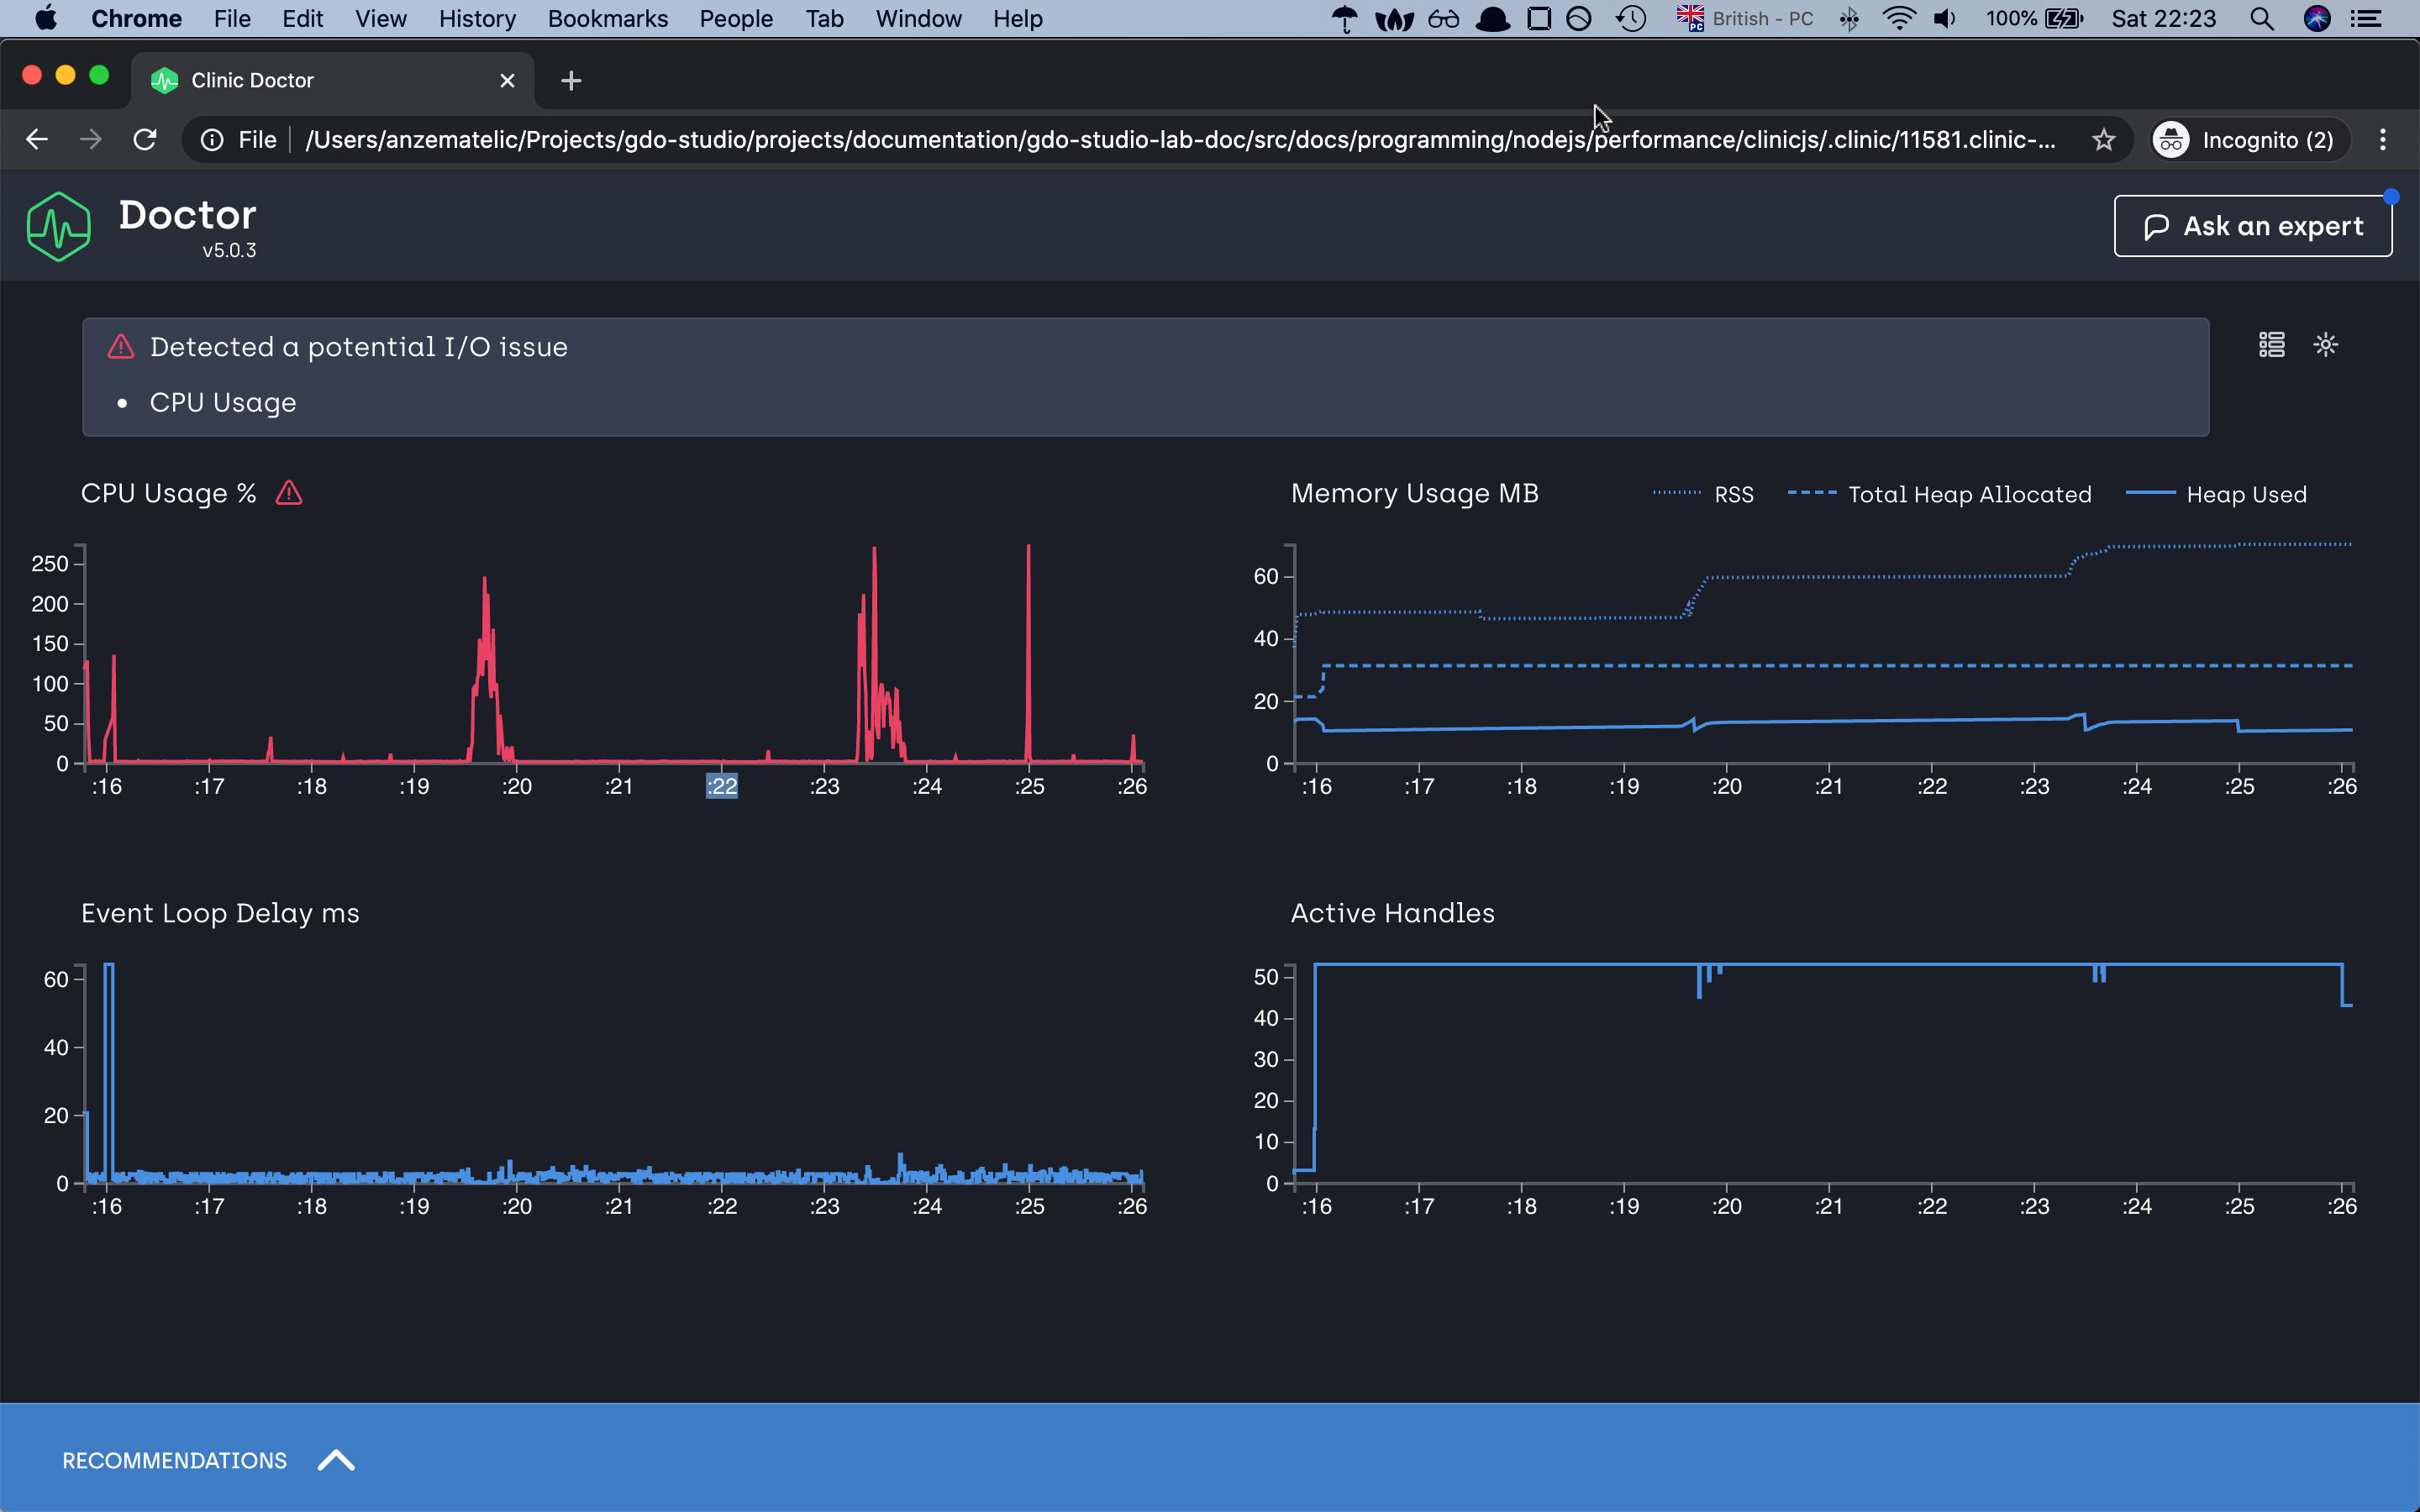
as you can already just see from the autocannon result our server Req/Sec has doubled. If we check our doctor graphs we can already see that we have
improved the event-loop delays. 2.5s to in worst-case scenario to 60ms, decrease the ram consumption and for the CPU usage, it has decreased but we have
some spikes with which doctor is not happy with 😅 but for this demonstration, i think we can leave with it.
Note that when looking at the CPU graph you might notice that it doesn’t necessarily go from 0-100 but might go from 0-200 or higher. This is because the percentage reflects the total amount of CPU cores your computer has. Node.js itself uses more than one thread behind the scene even though JavaScript is single threaded. V8 (The JavaScript engine) runs the garbage collector and some optimizations on background threads. With worker threads, the CPU will also utilize more than 100%. The visible percentage is always the combination of all these factors together.
With this demonstration we are finishing our first diasnostic type, and we cab move to the flame graph
Flame
as mentioned in the intro with the help of flame grapsh we can measure the time our function is being executed on the CPU and how long a function is on the top of the call stack.
The last function to be called is referred to as being at the top of the stack.
!important notes by default
clinicjsis looking for the function which are taking the most time to execute.
In this example, we have again a basic server that has the task of crunching a big number. The server is quite simple but we will fast find out that the first version has a big problem.
// slow-server.js
const { createServer } = require("http");
const { crackingNumbers } = require("./utils");

createServer(async (req, res) => {
  try {
    const total = crackingNumbers();
    res.end(`Total number is: ${total}`);
  } catch (error) {
    console.log(error);
  }
}).listen(8888, () => {
  console.log(`Server listening on port 8888`);
});
// utils.js

function crackingNumbers() {
  const total = 2000000000;
  let count = 0;

  for (let i = 0; i < total; i++) {
    count++;
  }

  return count;
}

module.exports = {
  crackingNumbers,
};
now let’s run our flame diagnostic tool to see the output
clinic flame --on-port 'autocannon localhost:8888' -- node slow-server.js
Server listening on port 8888
Running 10s test @ http://localhost:8888
10 connections
┌─────────┬─────────┬─────────┬─────────┬─────────┬────────────┬────────────┬────────────┐
│ Stat │ 2.5% │ 50% │ 97.5% │ 99% │ Avg │ Stdev │ Max │
├─────────┼─────────┼─────────┼─────────┼─────────┼────────────┼────────────┼────────────┤
│ Latency │ 1554 ms │ 5506 ms │ 9029 ms │ 9029 ms │ 5213.86 ms │ 2709.48 ms │ 9029.63 ms │
└─────────┴─────────┴─────────┴─────────┴─────────┴────────────┴────────────┴────────────┘
┌───────────┬─────┬──────┬───────┬───────┬────────┬────────┬───────┐
│ Stat │ 1% │ 2.5% │ 50% │ 97.5% │ Avg │ Stdev │ Min │
├───────────┼─────┼──────┼───────┼───────┼────────┼────────┼───────┤
│ Req/Sec │ 0 │ 0 │ 1 │ 1 │ 0.7 │ 0.46 │ 1 │
├───────────┼─────┼──────┼───────┼───────┼────────┼────────┼───────┤
│ Bytes/Sec │ 0 B │ 0 B │ 127 B │ 127 B │ 88.9 B │ 58.2 B │ 127 B │
└───────────┴─────┴──────┴───────┴───────┴────────┴────────┴───────┘
Req/Bytes counts sampled once per second.
7 requests in 10.05s, 889 B read
4 errors (4 timeouts)
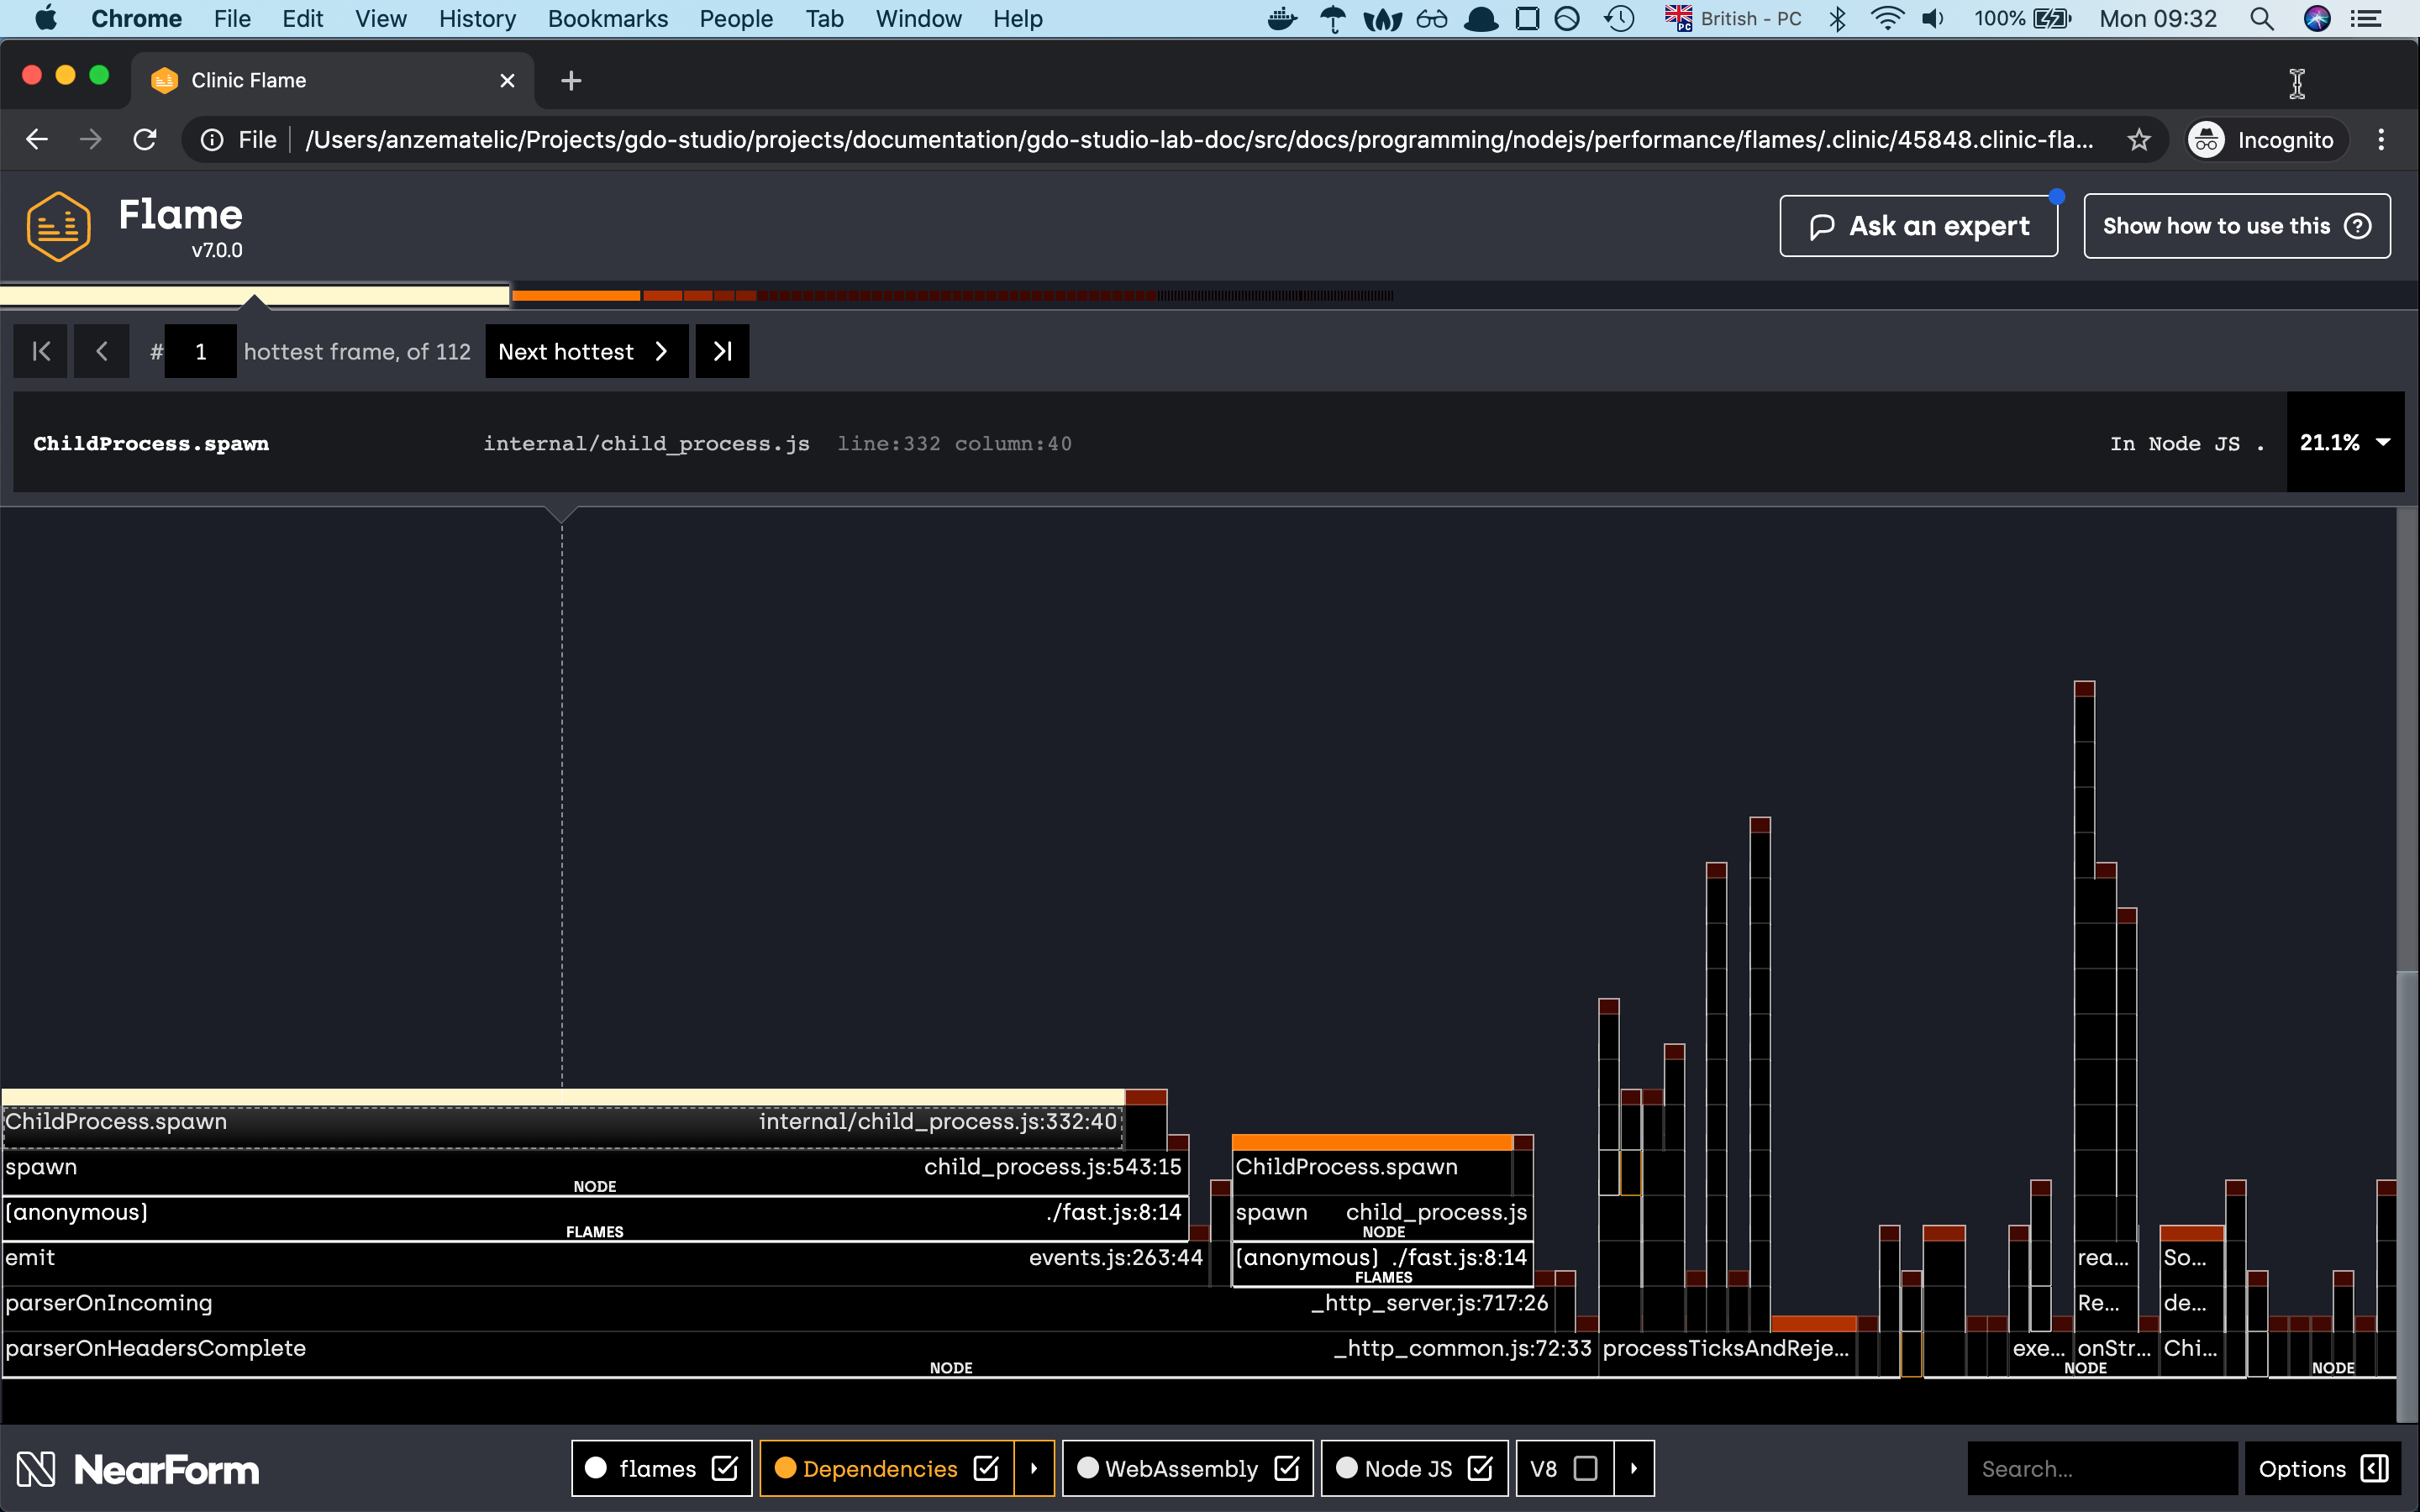
Analysing data
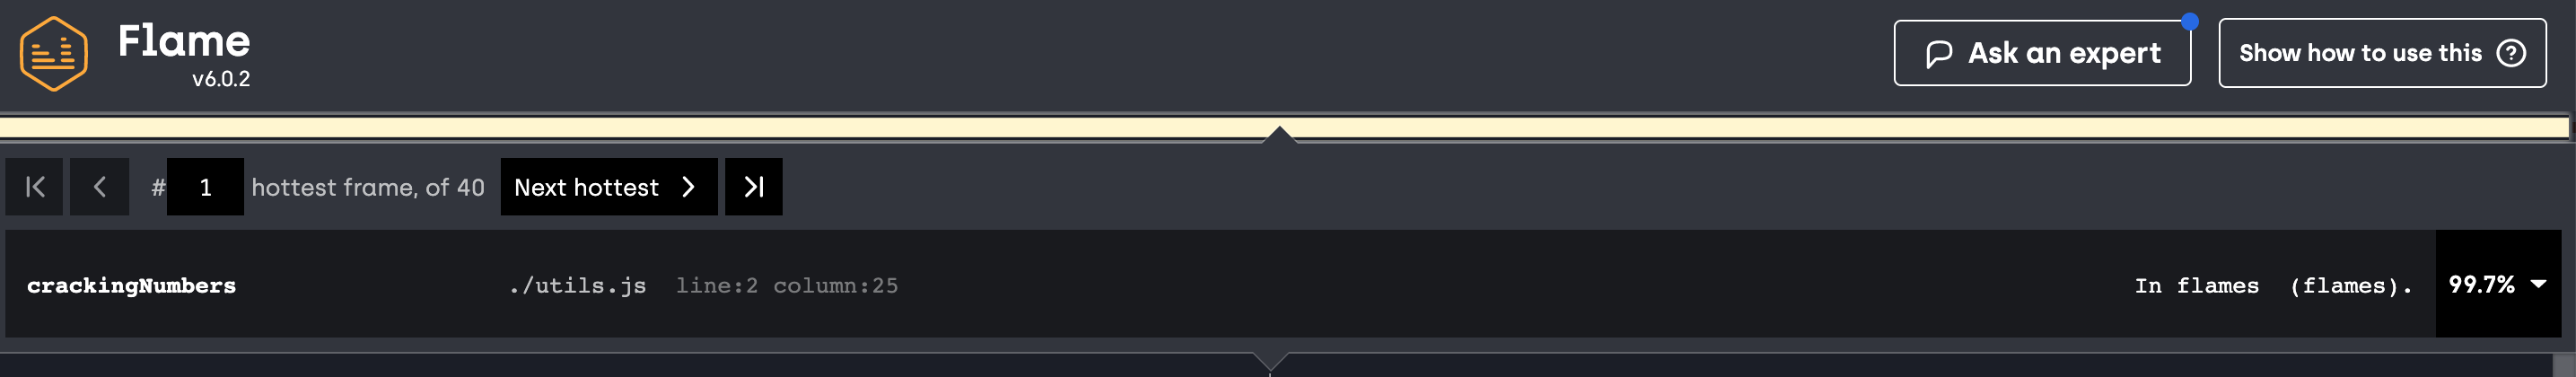
as you can see from the graph 99.8% of our time is being spent on the crackingNumbers function which is not good. Because our
app is executing so much on the CPU it means that the event loop is being blocked if we generate the graph with the previous doctor command
we wil see that the CPU and Event Loop Delay chart will be critical.
So what would be a good solution to fix this problem? To be honest there are many different options. Like worker threads,
or create a task queue and many more but win our case we will again use the spawn function
with which we will create a separate process for every request and send the data back to the client.
Now if we run the test again we should see a different picture.
Server listening on port 8888
Running 10s test @ http://localhost:8888
10 connections

┌─────────┬─────────┬─────────┬─────────┬─────────┬────────────┬─────────┬────────────┐
│ Stat    │ 2.5%    │ 50%     │ 97.5%   │ 99%     │ Avg        │ Stdev   │ Max        │
├─────────┼─────────┼─────────┼─────────┼─────────┼────────────┼─────────┼────────────┤
│ Latency │ 4092 ms │ 4291 ms │ 4429 ms │ 4429 ms │ 4271.86 ms │ 74.1 ms │ 4429.65 ms │
└─────────┴─────────┴─────────┴─────────┴─────────┴────────────┴─────────┴────────────┘
┌───────────┬─────┬──────┬─────┬─────────┬───────┬───────┬─────────┐
│ Stat      │ 1%  │ 2.5% │ 50% │ 97.5%   │ Avg   │ Stdev │ Min     │
├───────────┼─────┼──────┼─────┼─────────┼───────┼───────┼─────────┤
│ Req/Sec   │ 0   │ 0    │ 0   │ 10      │ 2     │ 4     │ 10      │
├───────────┼─────┼──────┼─────┼─────────┼───────┼───────┼─────────┤
│ Bytes/Sec │ 0 B │ 0 B  │ 0 B │ 1.44 kB │ 288 B │ 576 B │ 1.44 kB │
└───────────┴─────┴──────┴─────┴─────────┴───────┴───────┴─────────┘

Req/Bytes counts sampled once per second.

20 requests in 10.06s, 2.88 kB read
Analysing data
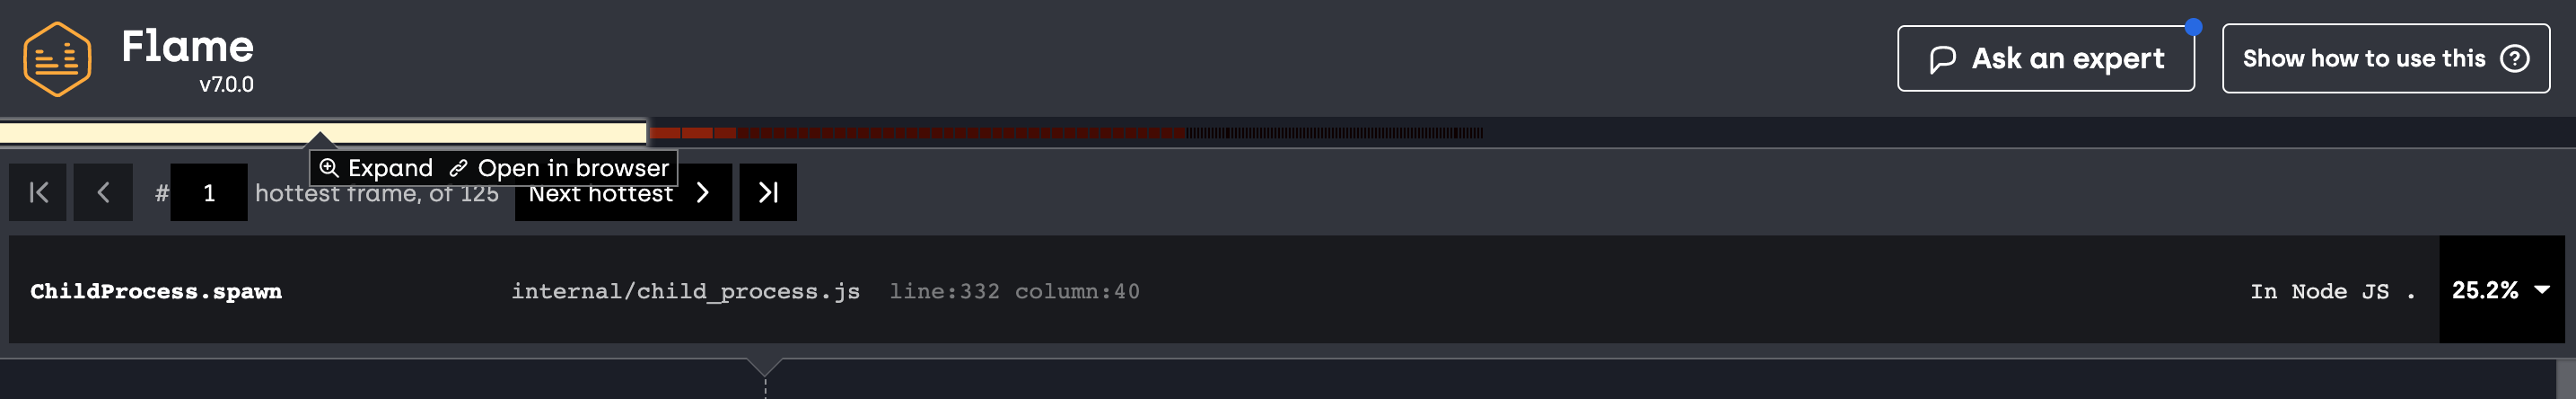
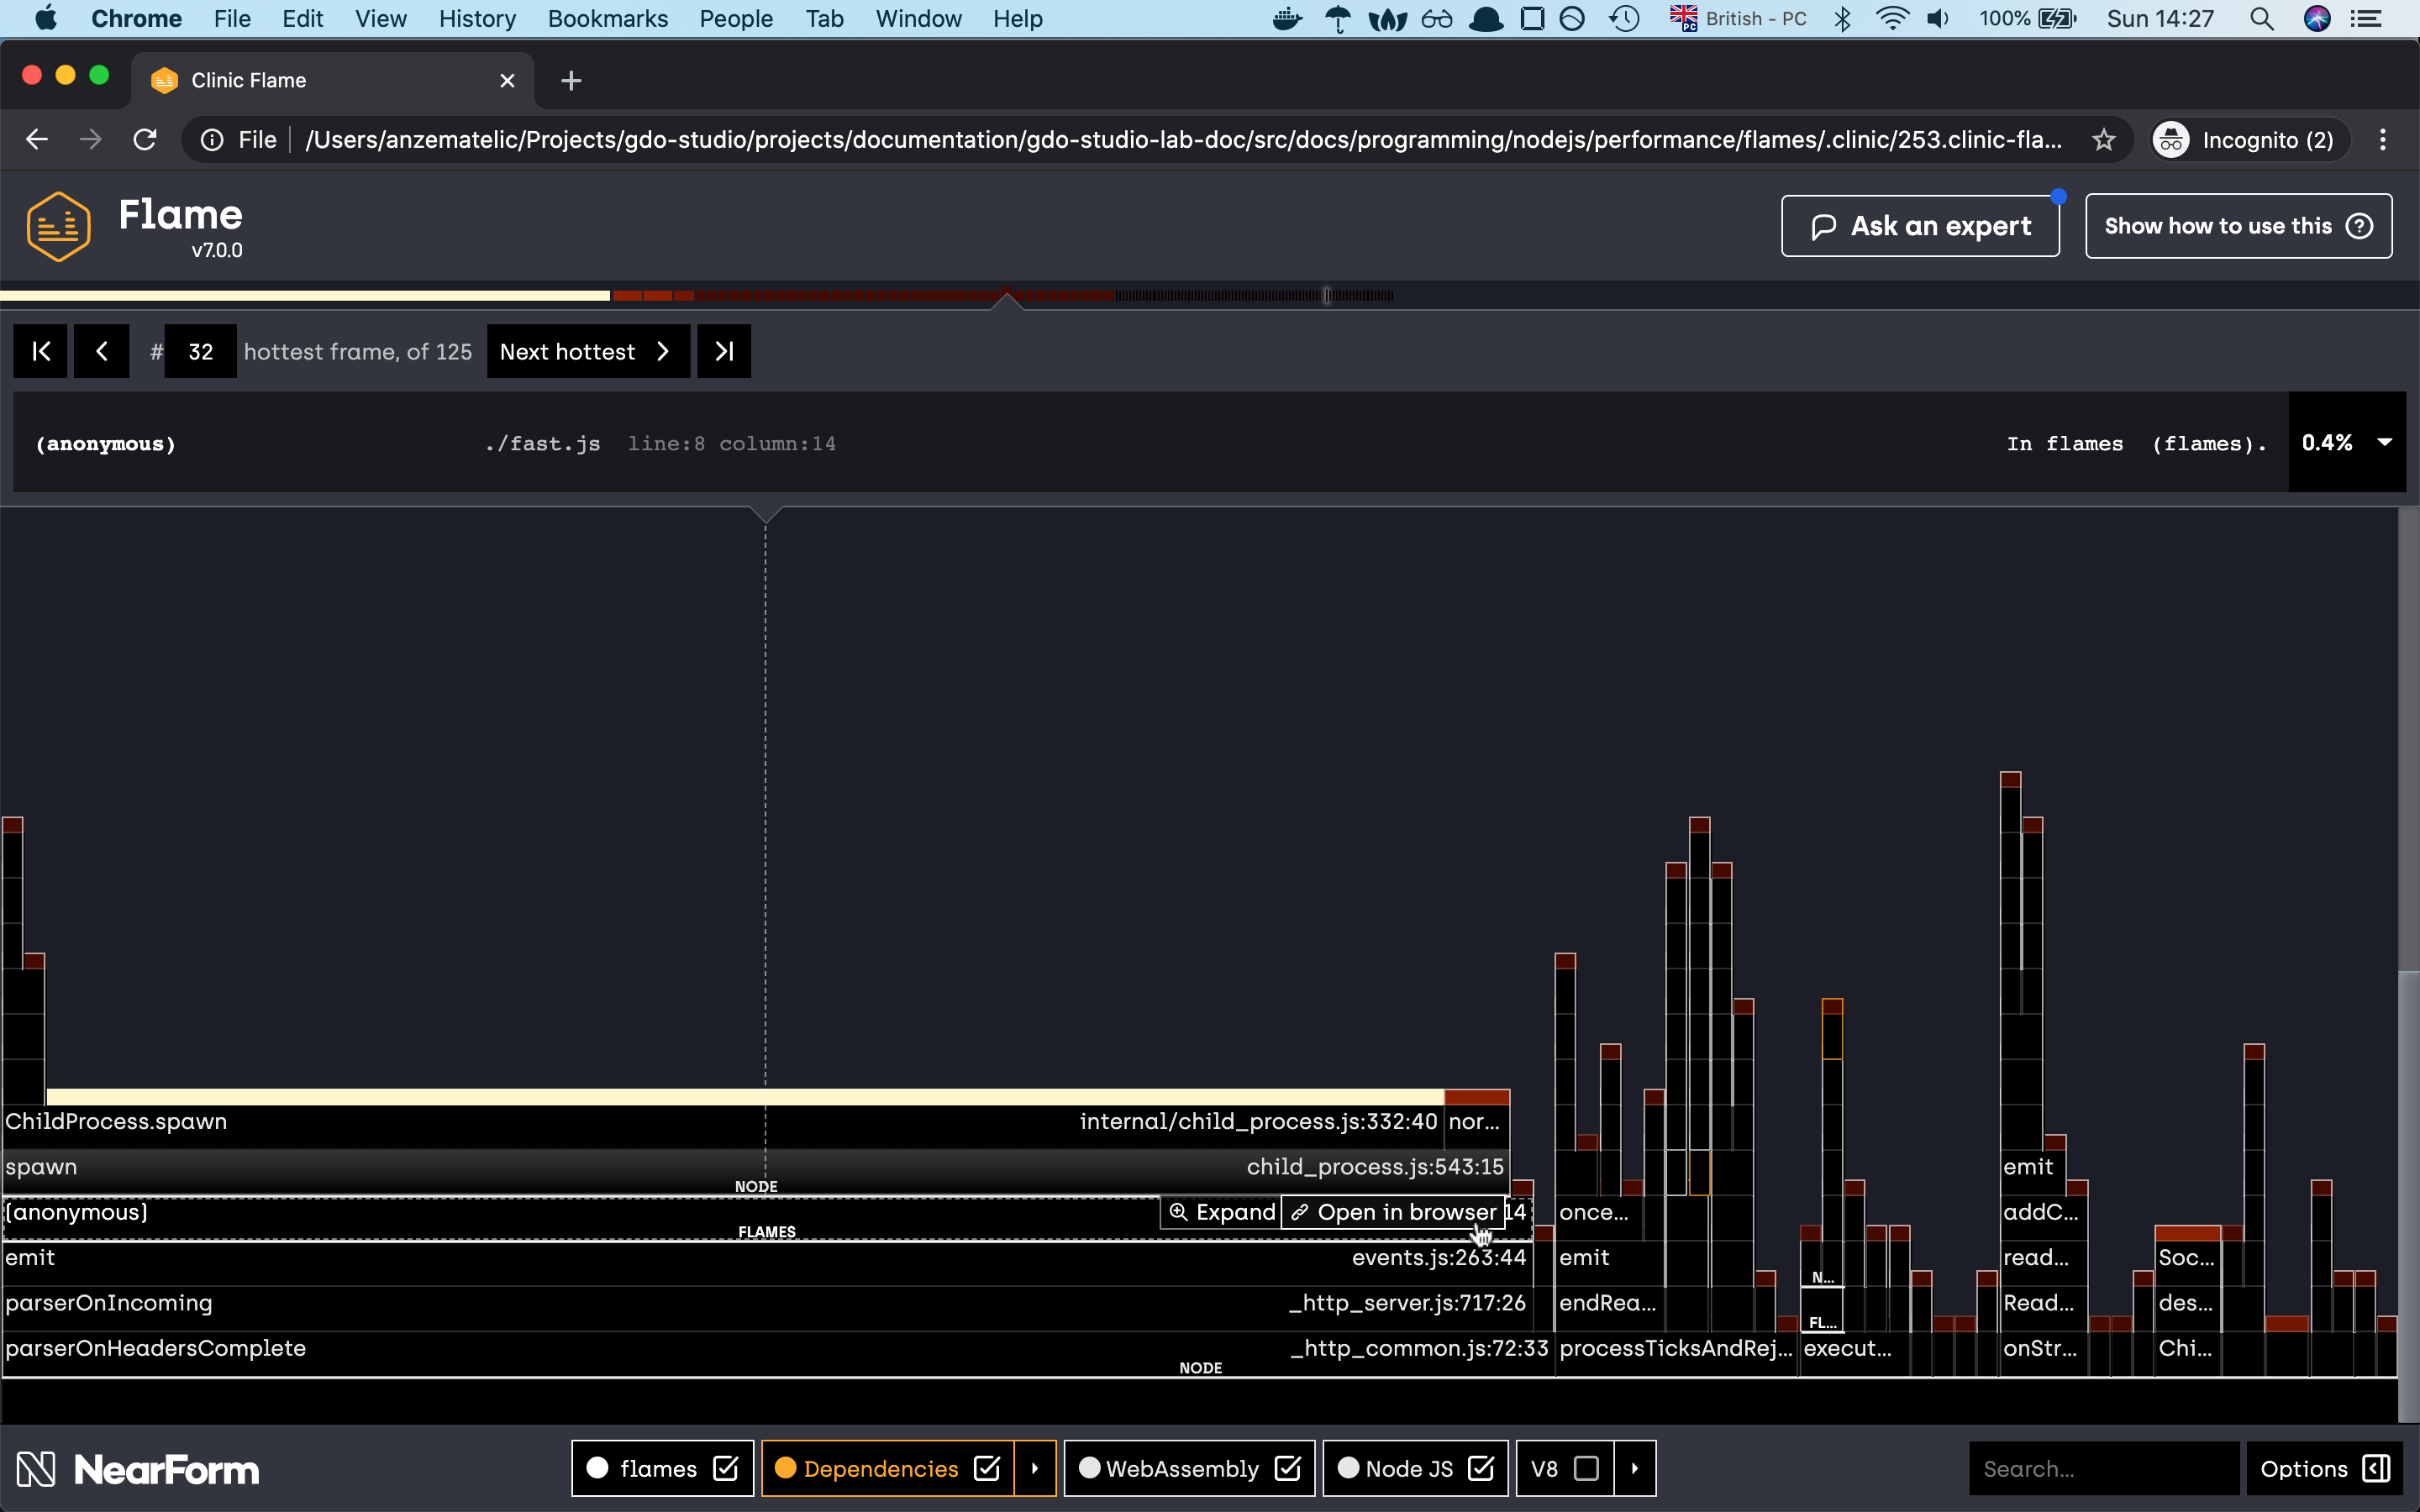
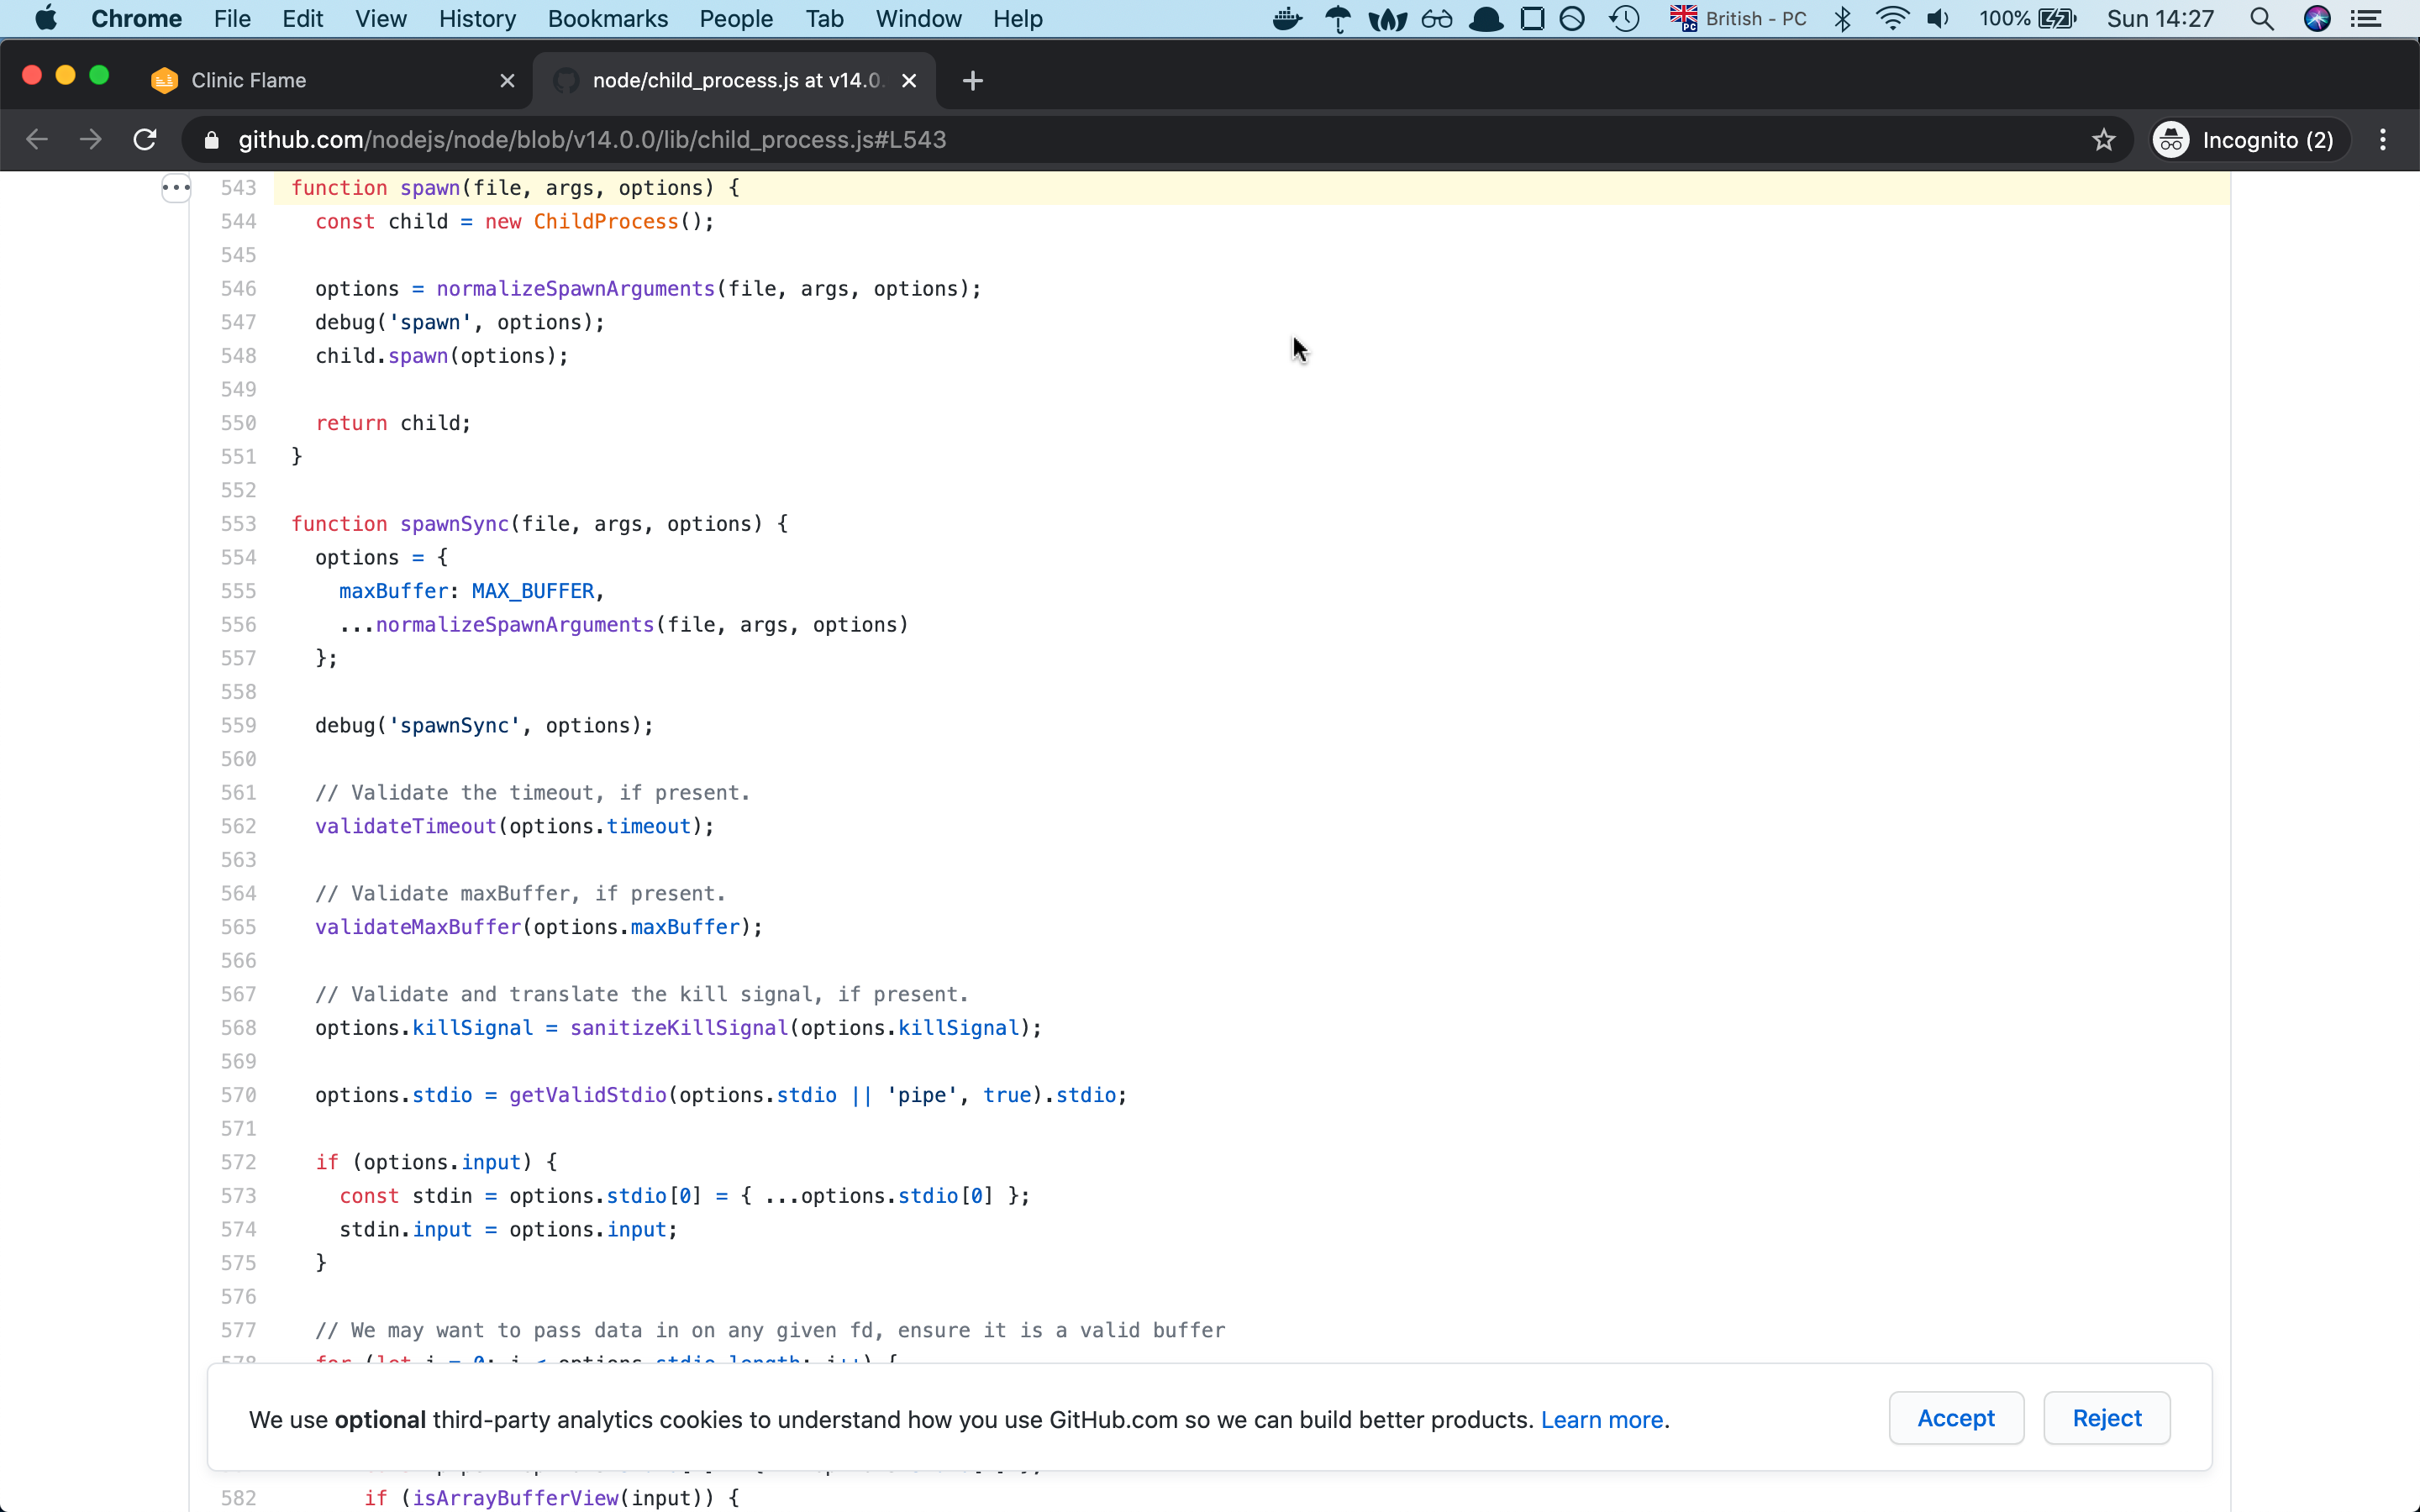
if one of the native modules is causing big function delay, you can check the native module implementaion with the help of flame graph, there is an option for checking the module implementation to github.
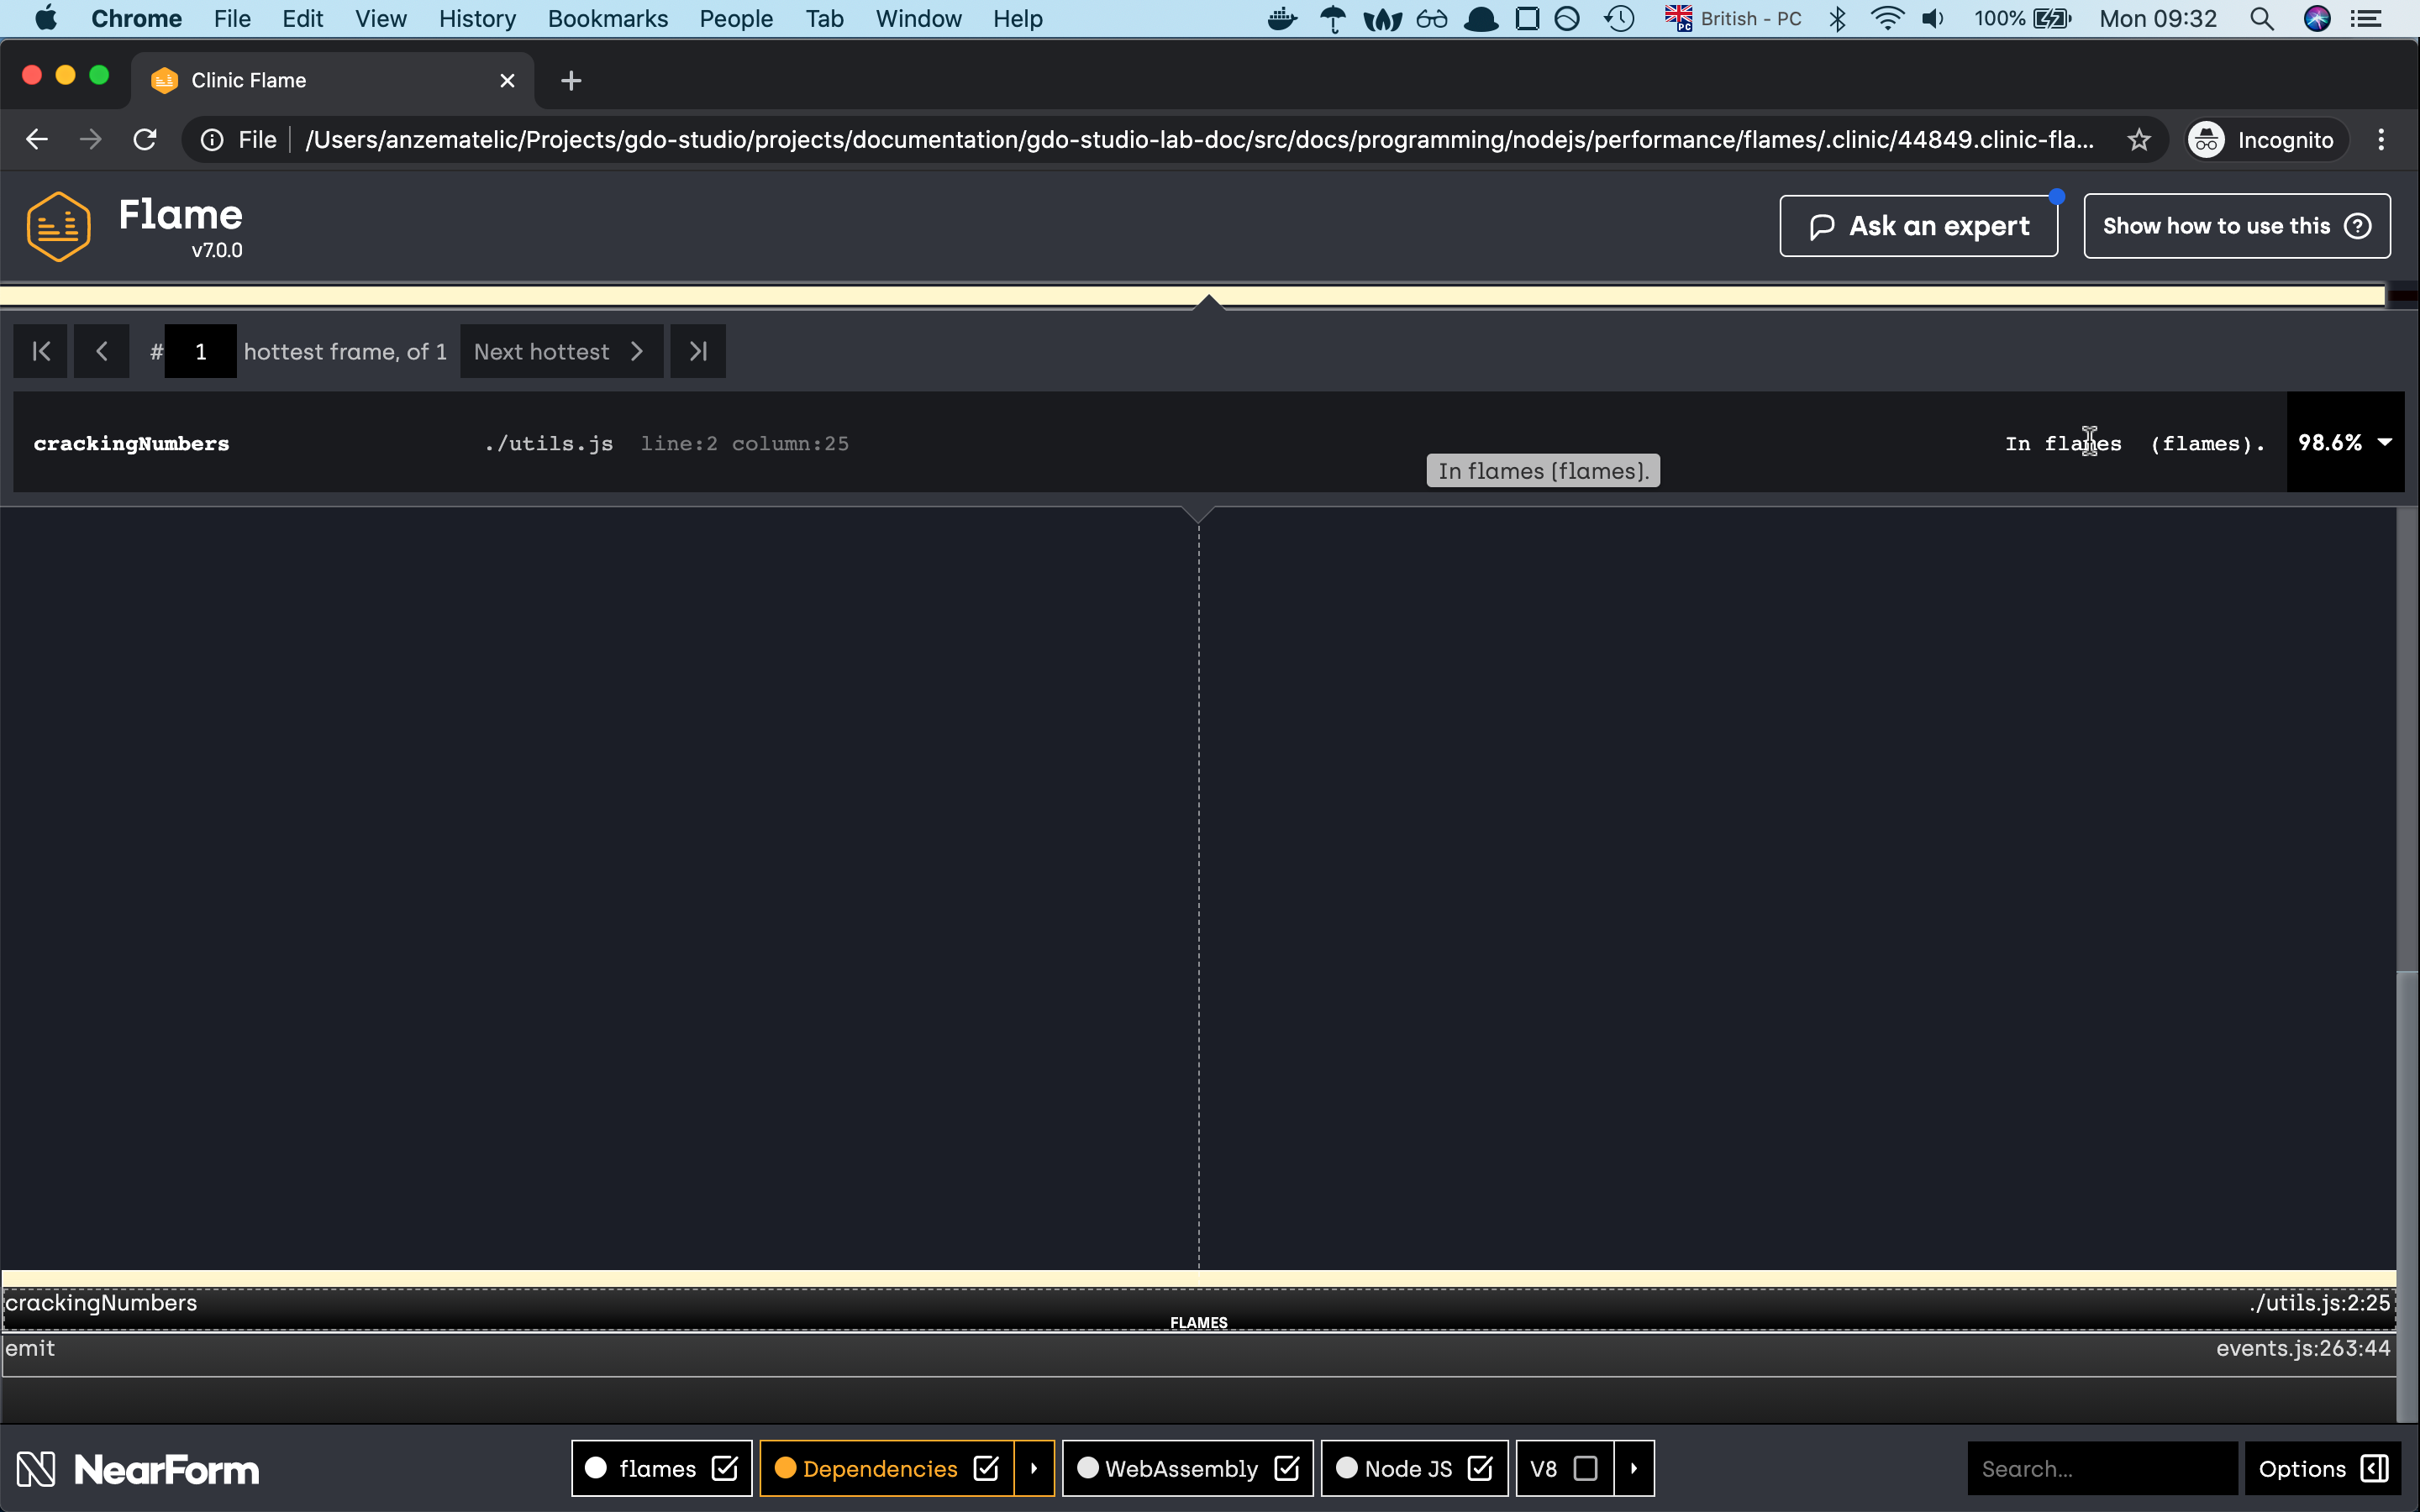
and yes as you can see, with the new change of the spawn module we have changed the share of our flame graph.
the graph seems more diverse like before and even our crackingNumbers which is now Childprocess.spawn is right now consuming
only 25% of CPU time compared to before where it was taking 99.7%. I think this is quite a good improvement from before.
so now that we have seen the flame graph in action let’s check the last diagnostic tool
Bubbleprof
Bubbleprof is a new way, approach for you to profile your nodejs app. Compare to the previous profilers bubbleprof is used for profiling your asynchronous code.
To know bubblesort under the hood is using async_hooks in case you want to make your own implementation check out the above documentation.
Our code example is quite simple. The server in our case will return back just a response which will be a delay with some async code.
In our case, we will mock the async code with the help of setTimeout and promises. With that, we will fake the delay in our responses.
// slow-bubble-server.js
const { createServer } = require("http");
const { waitOld } = require("./util");

const PORT = 8888;

createServer((_, res) => {
  Promise.resolve()
    .then(() => waitOld(2000))
    .then(() => waitOld(5000))
    .then(() => waitOld(8000))
    .then(() => res.end("end request"))
    .catch(err => console.error(err));
}).listen(PORT, () => {
  console.log(`Slow server listening on port: ${PORT}`);
});
// util.js
const waitOld = (time = 500) =>
  new Promise(resolve => {
    let wait = setTimeout(() => {
      clearTimeout(wait);
      resolve();
    }, time);
  });

module.exports = {
  waitOld,
};
now that we know the logic behind our server let’s run the diagnostic tool.
clinic bubbleprof --on-port 'autocannon -c 10 -a 20 -t 20 localhost:$PORT' -- node slow.js
as you can see in this request we are adding two new parameters to autocannon which are -a for the number of responses we are expecting back from the server
and the flag -t which is for the timeout of our request. Our slow server will need for one request more than 15s so we have to set up the timeout higher.
Otherwise, the request will fail.
Now if we run the command we should see the below input.
Slow server listening on port: 8888
Warning: The code is transpiled, bubbleprof does not support source maps yet.
Running 20 requests test @ http://localhost:8888
10 connections

┌─────────┬──────────┬──────────┬──────────┬──────────┬────────────┬──────────┬─────────────┐
│ Stat    │ 2.5%     │ 50%      │ 97.5%    │ 99%      │ Avg        │ Stdev    │ Max         │
├─────────┼──────────┼──────────┼──────────┼──────────┼────────────┼──────────┼─────────────┤
│ Latency │ 15021 ms │ 15027 ms │ 15052 ms │ 15052 ms │ 15034.3 ms │ 11.82 ms │ 15052.04 ms │
└─────────┴──────────┴──────────┴──────────┴──────────┴────────────┴──────────┴─────────────┘
┌───────────┬─────┬──────┬─────┬─────────┬──────┬───────┬───────┐
│ Stat      │ 1%  │ 2.5% │ 50% │ 97.5%   │ Avg  │ Stdev │ Min   │
├───────────┼─────┼──────┼─────┼─────────┼──────┼───────┼───────┤
│ Req/Sec   │ 0   │ 0    │ 0   │ 10      │ 0.67 │ 2.28  │ 2     │
├───────────┼─────┼──────┼─────┼─────────┼──────┼───────┼───────┤
│ Bytes/Sec │ 0 B │ 0 B  │ 0 B │ 1.11 kB │ 74 B │ 252 B │ 222 B │
└───────────┴─────┴──────┴─────┴─────────┴──────┴───────┴───────┘

Req/Bytes counts sampled once per second.

20 requests in 30.13s, 2.22 kB read
Analysing data
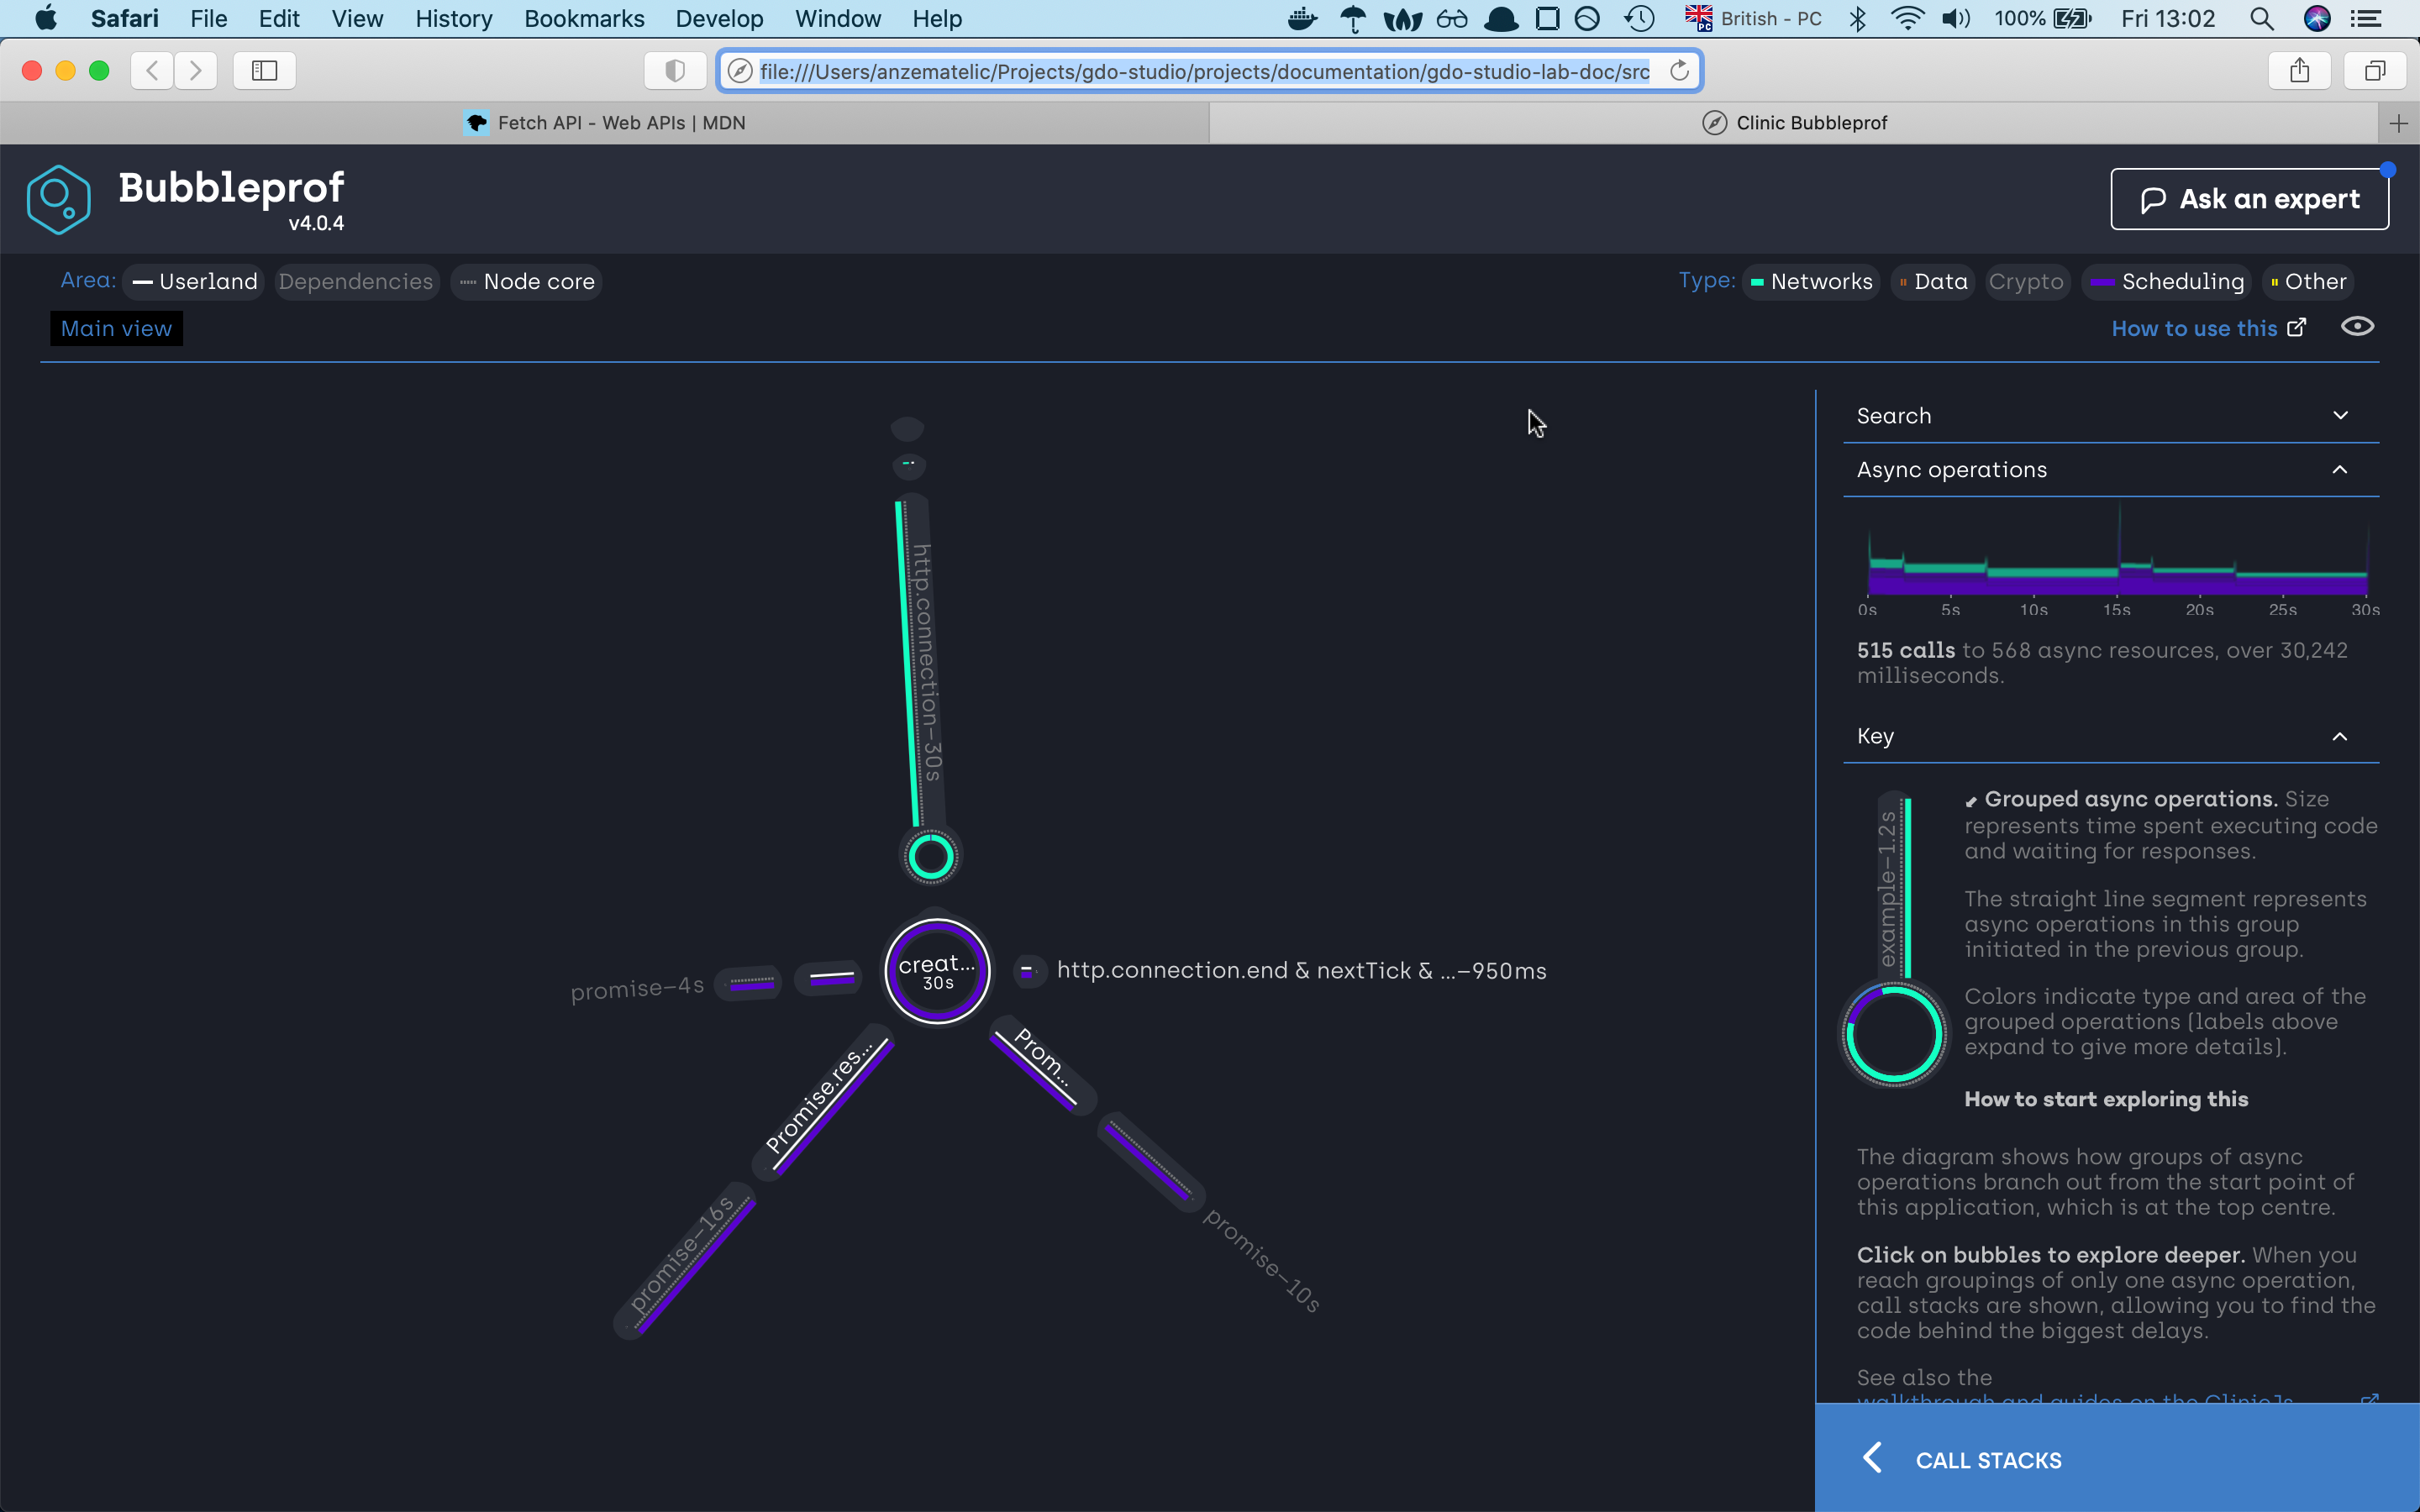
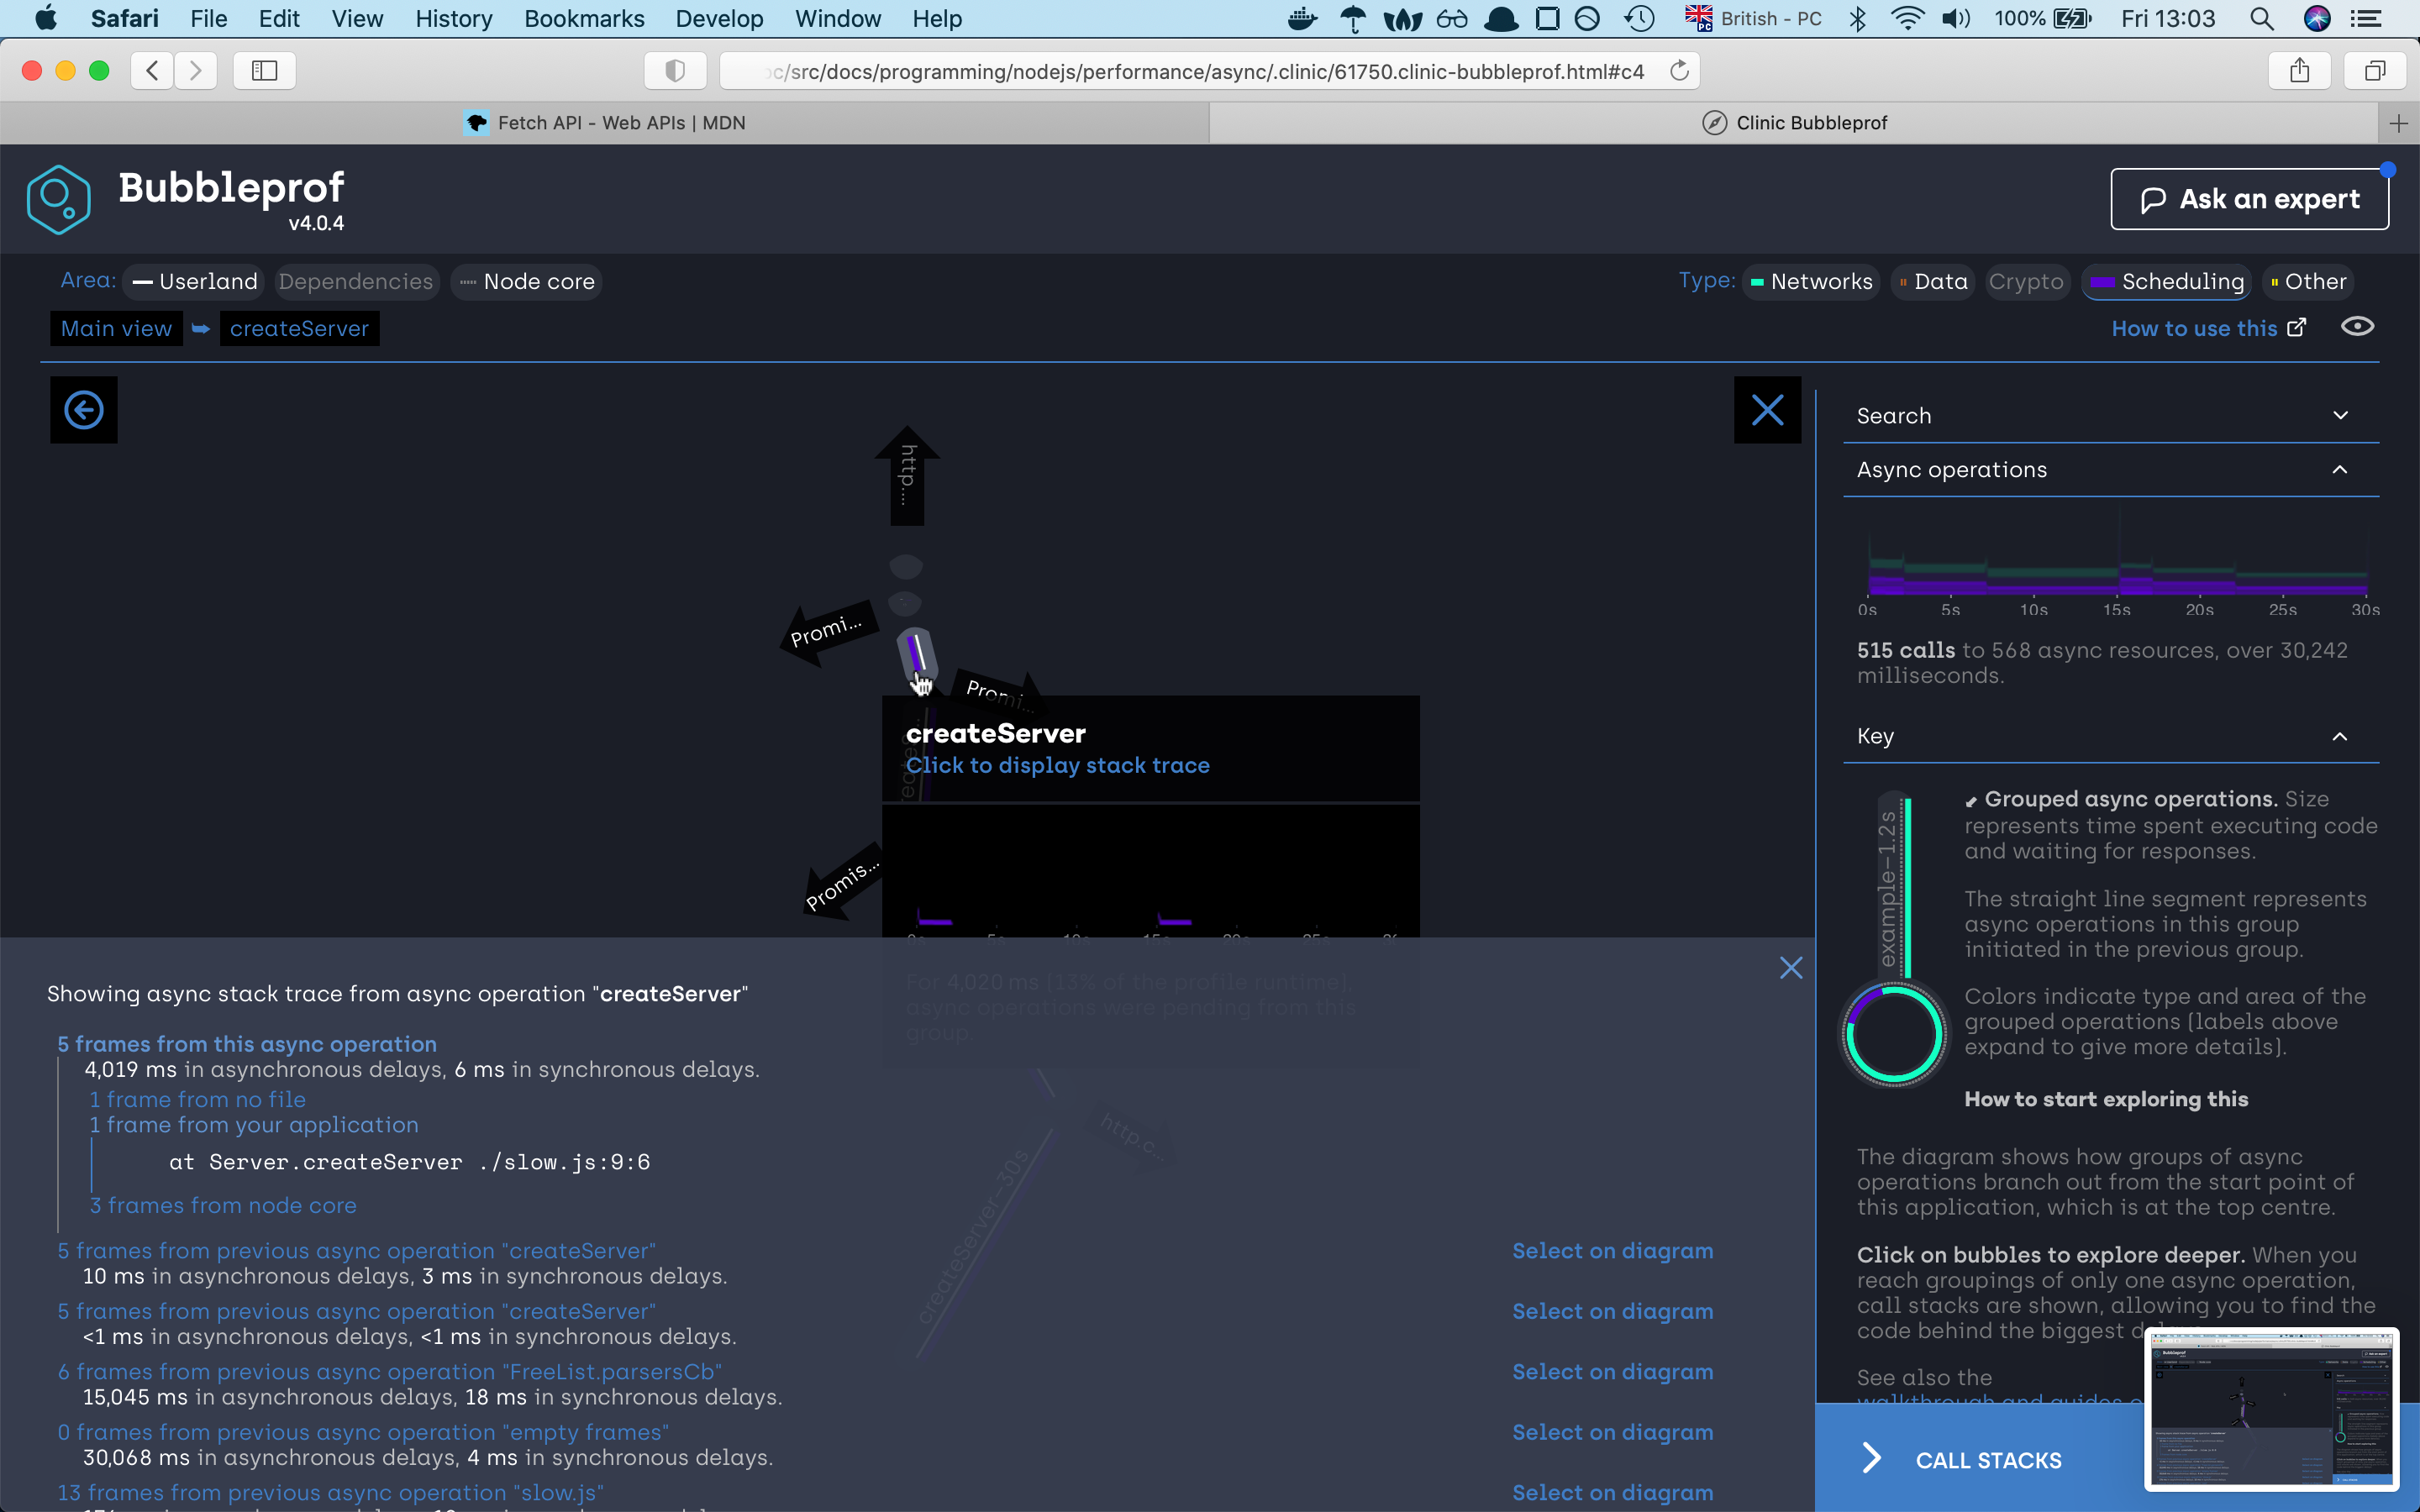
A bubble represents a group of async operations. The more time spent within a group of async operations, the bigger the bubble is. The longer the lines between bubbles, the more latency exists between them.
on the left side we can investigate what type of code caused the asyncs problems, we have
userlandwhich is our code,Dependencieswhich are npm modules andNode corewhich as the name already tells node internal code. On the right site we can filter our code by async types. There areNetwork,Data,Crypto,Schedulingand otherOtherin our example we are using mostlySchedulingthat’s why our lines and bubbles are mostly purrple
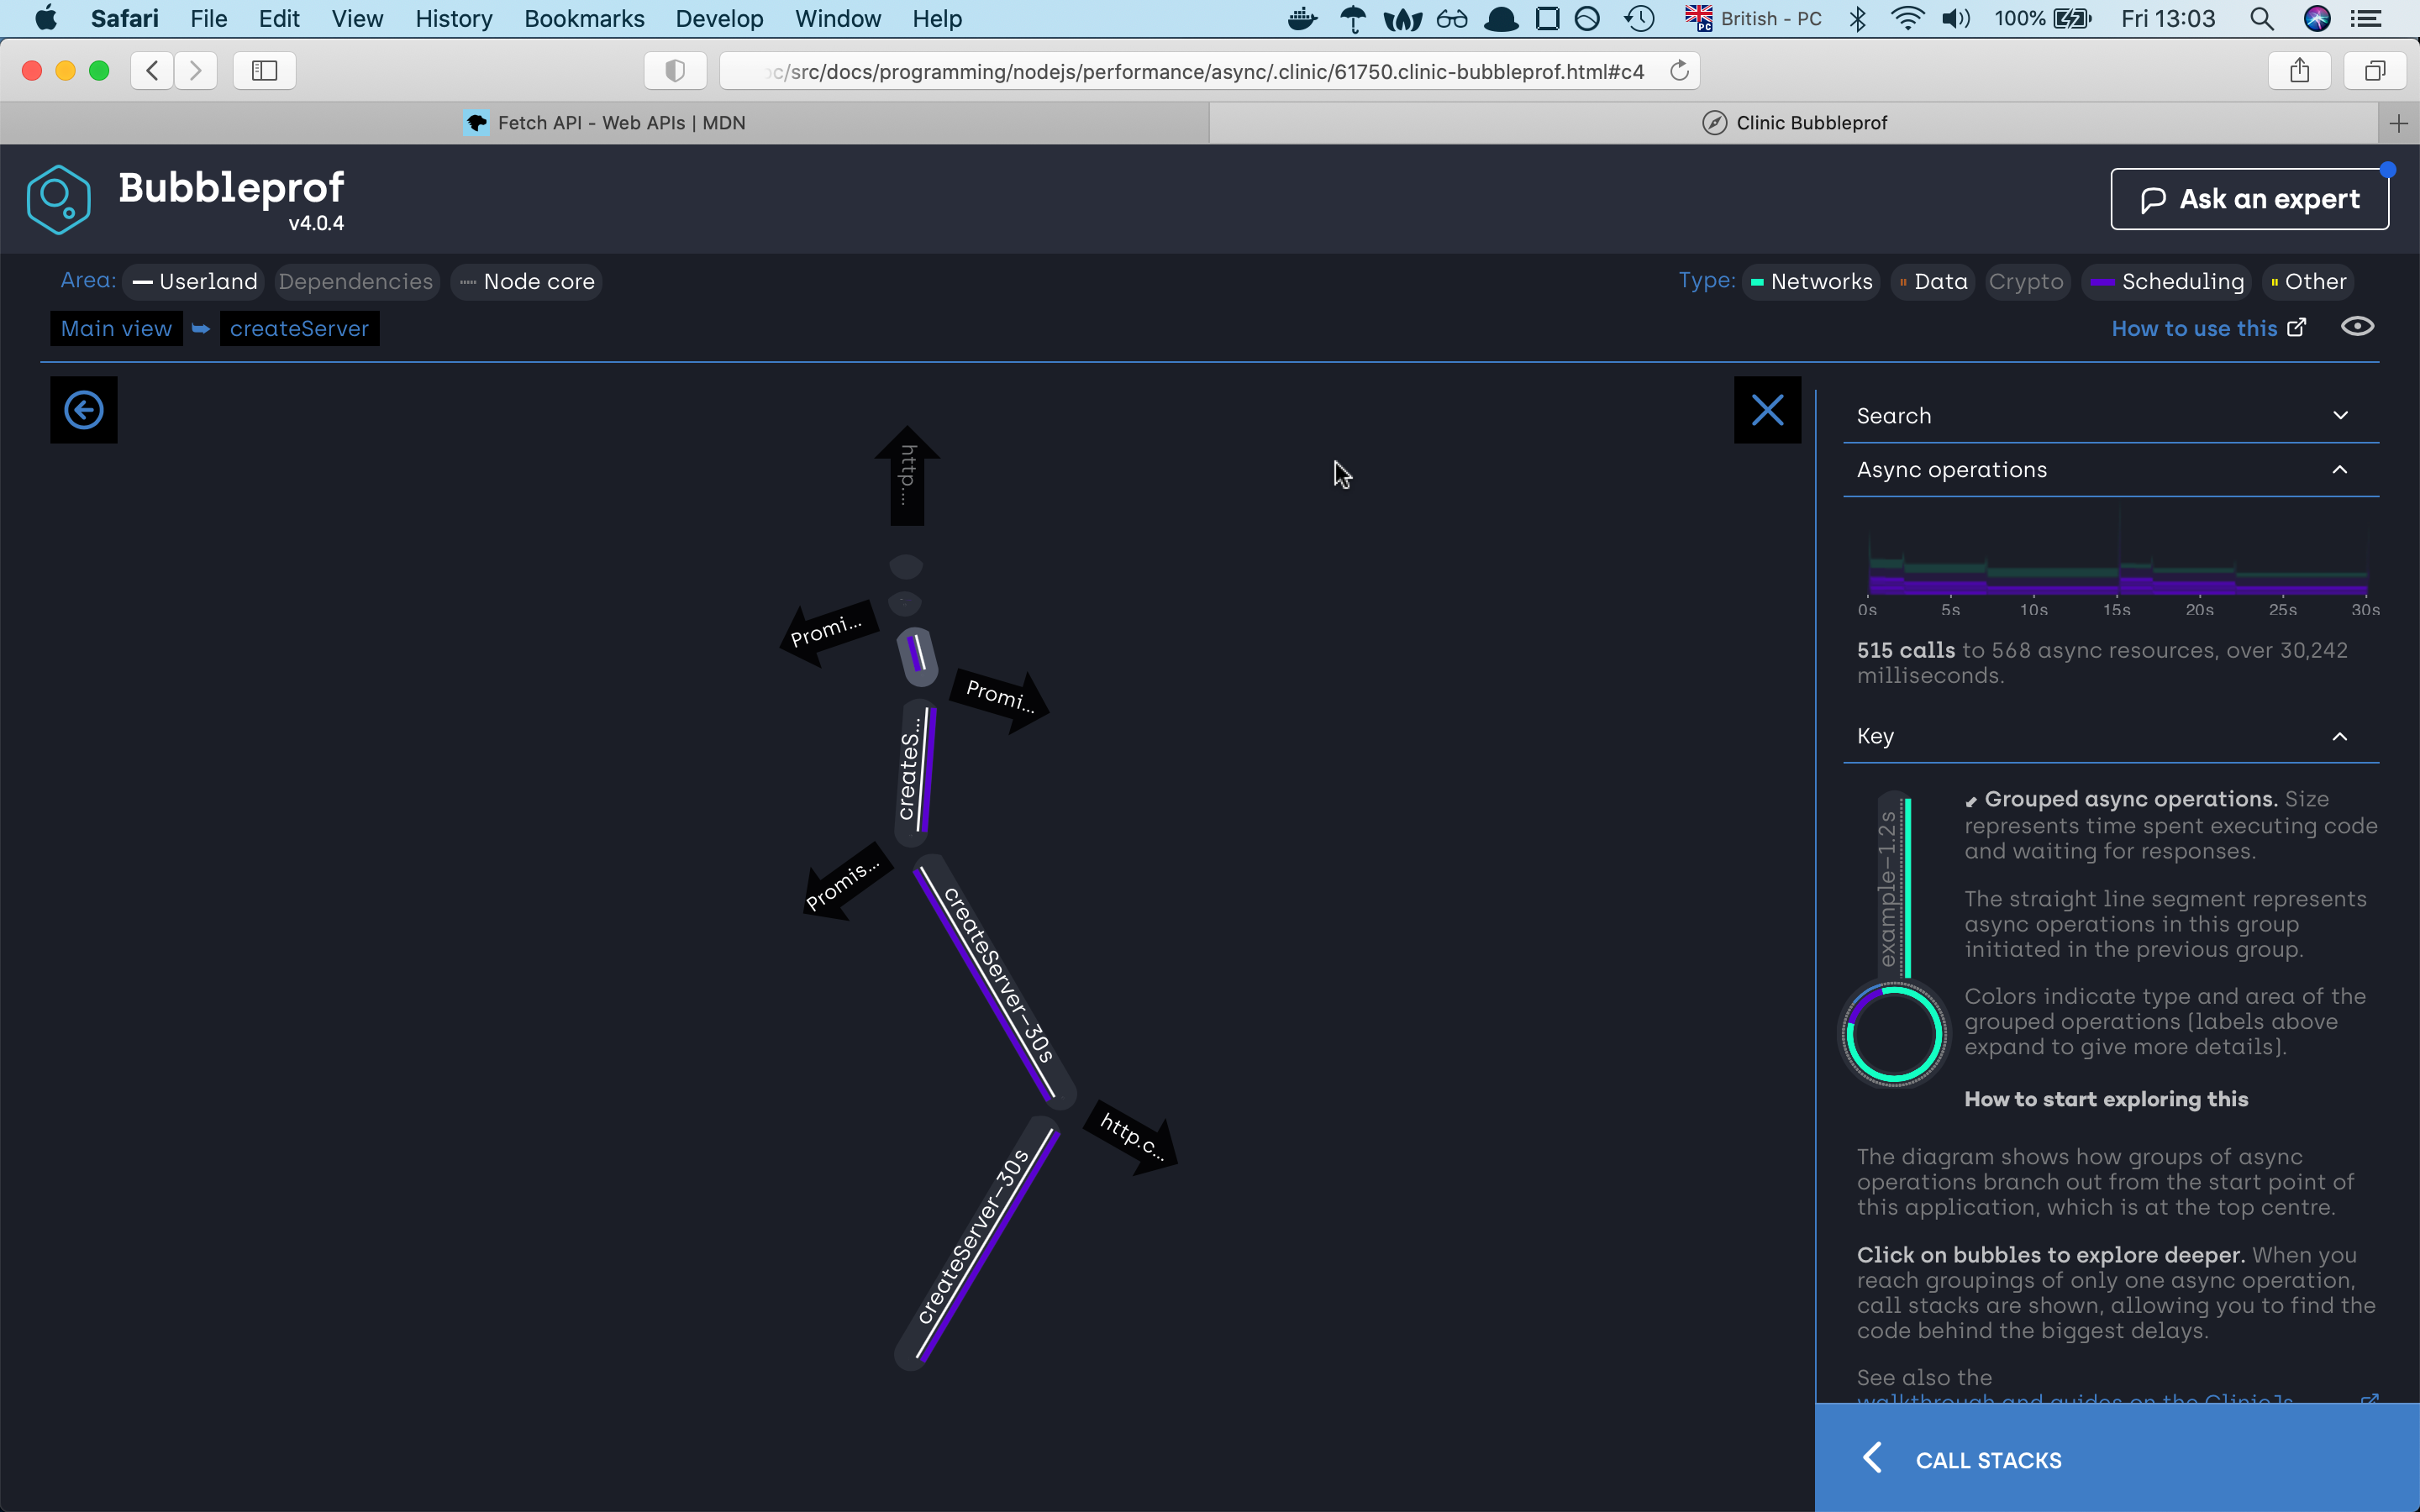
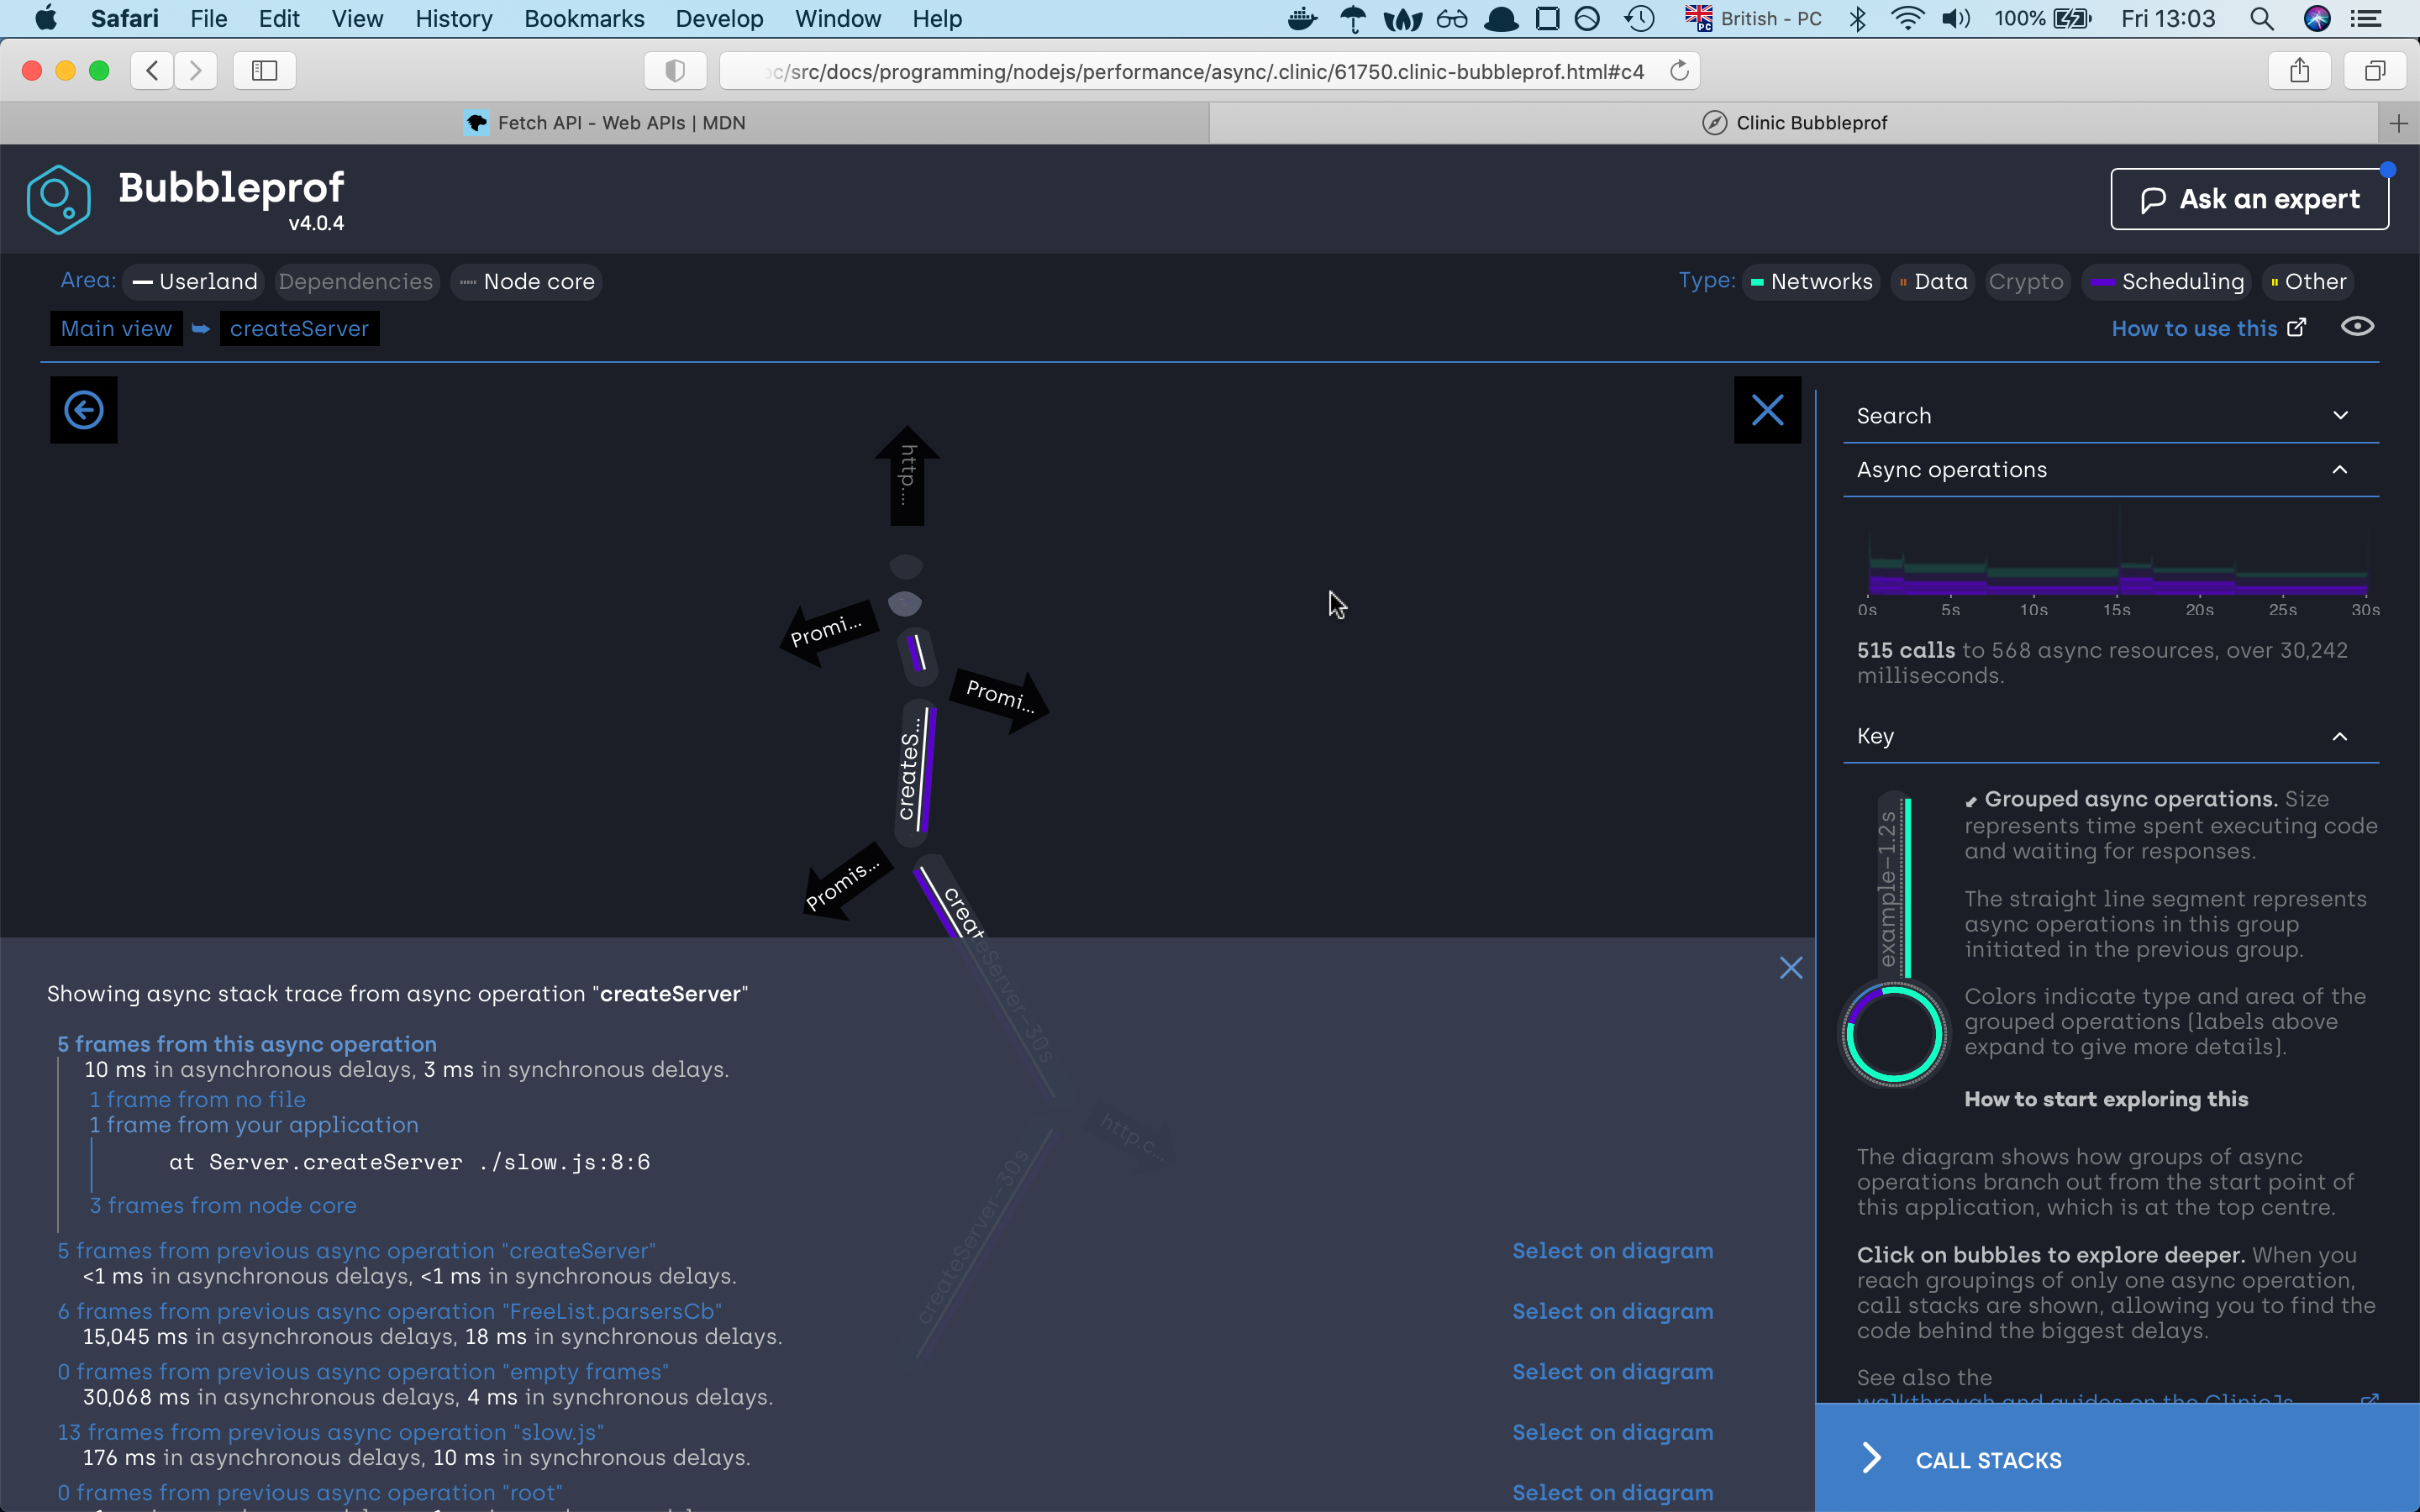
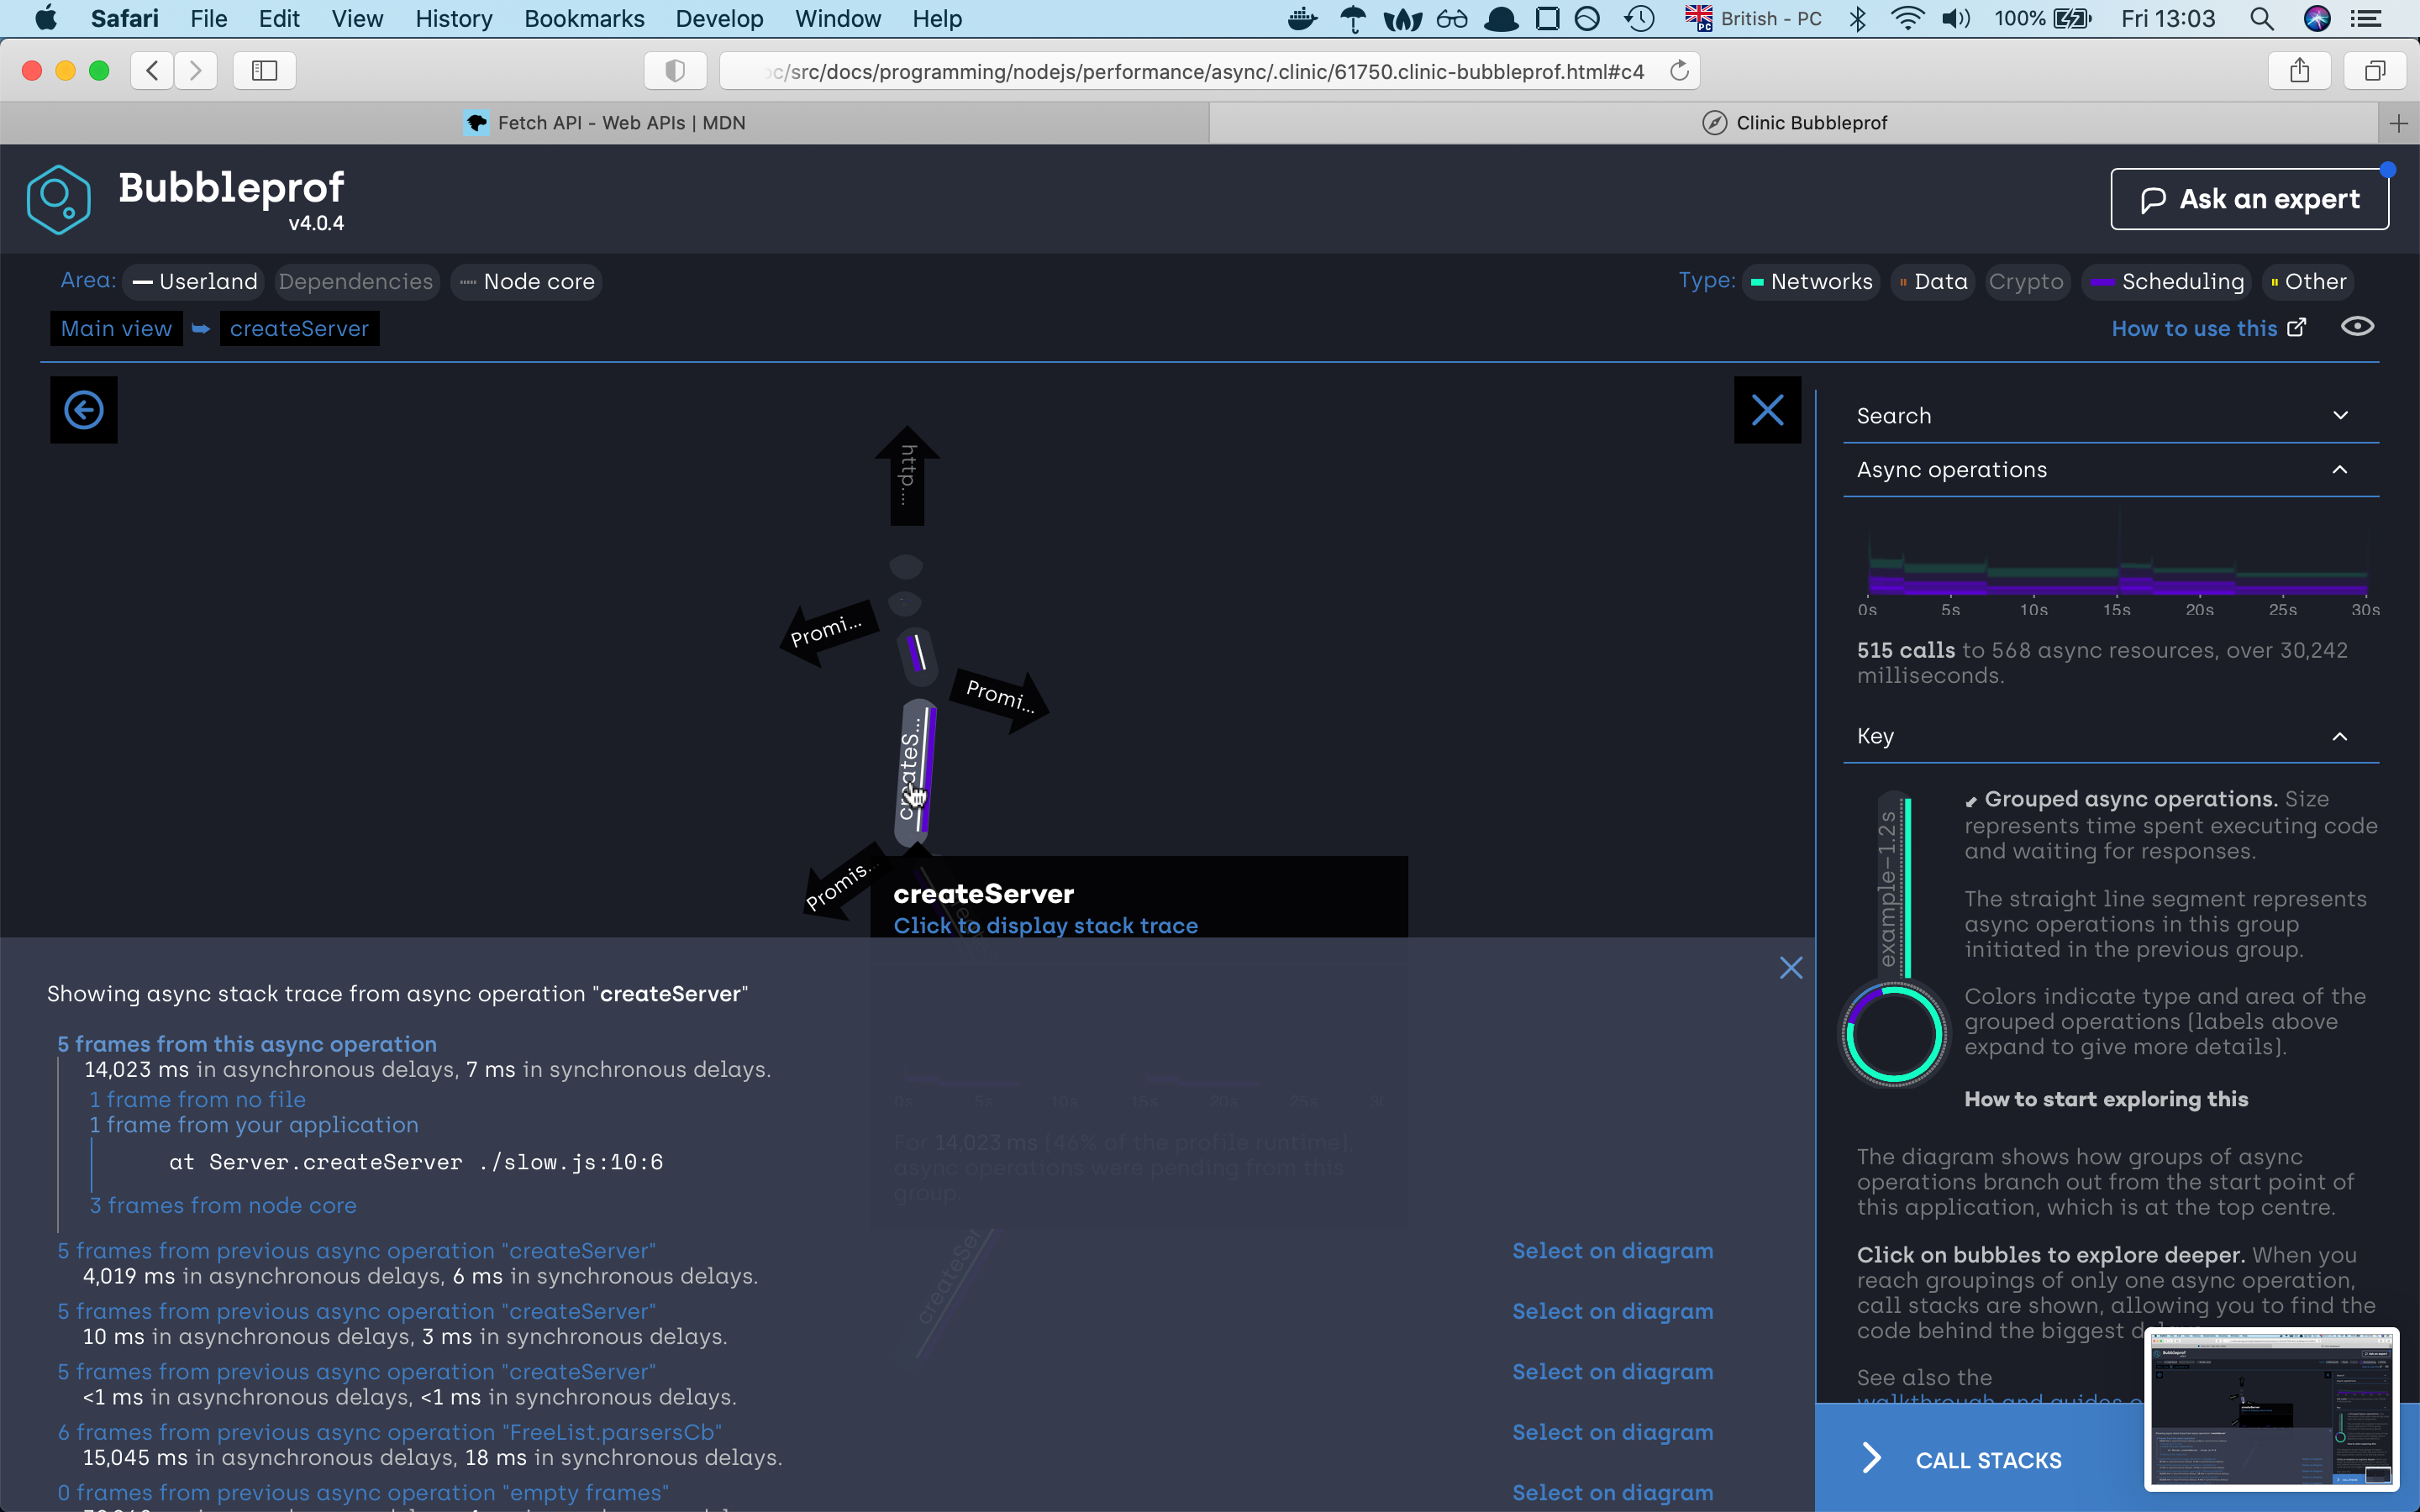
we can see that the server needed 30 seconds to finish the request. If we click on the 30s bubble should see the async code
execution by the promise sequence if we click on any of the lines we will find out which part of the code war responsive for that line,
if we investigate the path we will very fast find out that the async code is happening sequence which is not the best solution.
So let’s try to improve our code. For this, we will use the Promise.all function which will execute
all our three promises concurrency concurrently
With this rather than having to wait for every promise to first finish and then start the next promise, we will now start all promise
at the same time and reduce the time to finish the whole task.
So let’s look at the code:
// "fast.js"
const { createServer } = require("http");
const { waitOld } = require("./util");

const PORT = 8888;

createServer(async (_, res) => {
  await Promise.all([waitOld(2000), waitOld(5000), waitOld(8000)]);
  res.end("finished");
}).listen(PORT, () => {
  console.log(`Fast server listening on port: ${PORT}`);
});
if we now run the previous command with the new upgraded server we should now see quite an improvement.
Fast server listening on port: 8888
Warning: The code is transpiled, bubbleprof does not support source maps yet.
Running 20 requests test @ http://localhost:8888
10 connections

┌─────────┬─────────┬─────────┬─────────┬─────────┬────────────┬─────────┬────────────┐
│ Stat    │ 2.5%    │ 50%     │ 97.5%   │ 99%     │ Avg        │ Stdev   │ Max        │
├─────────┼─────────┼─────────┼─────────┼─────────┼────────────┼─────────┼────────────┤
│ Latency │ 8018 ms │ 8021 ms │ 8040 ms │ 8040 ms │ 8026.25 ms │ 7.63 ms │ 8040.81 ms │
└─────────┴─────────┴─────────┴─────────┴─────────┴────────────┴─────────┴────────────┘
┌───────────┬─────┬──────┬─────┬───────┬───────┬───────┬───────┐
│ Stat      │ 1%  │ 2.5% │ 50% │ 97.5% │ Avg   │ Stdev │ Min   │
├───────────┼─────┼──────┼─────┼───────┼───────┼───────┼───────┤
│ Req/Sec   │ 0   │ 0    │ 0   │ 9     │ 1.18  │ 2.73  │ 1     │
├───────────┼─────┼──────┼─────┼───────┼───────┼───────┼───────┤
│ Bytes/Sec │ 0 B │ 0 B  │ 0 B │ 963 B │ 126 B │ 292 B │ 107 B │
└───────────┴─────┴──────┴─────┴───────┴───────┴───────┴───────┘

Req/Bytes counts sampled once per second.

20 requests in 17.09s, 2.14 kB read
Analysing data
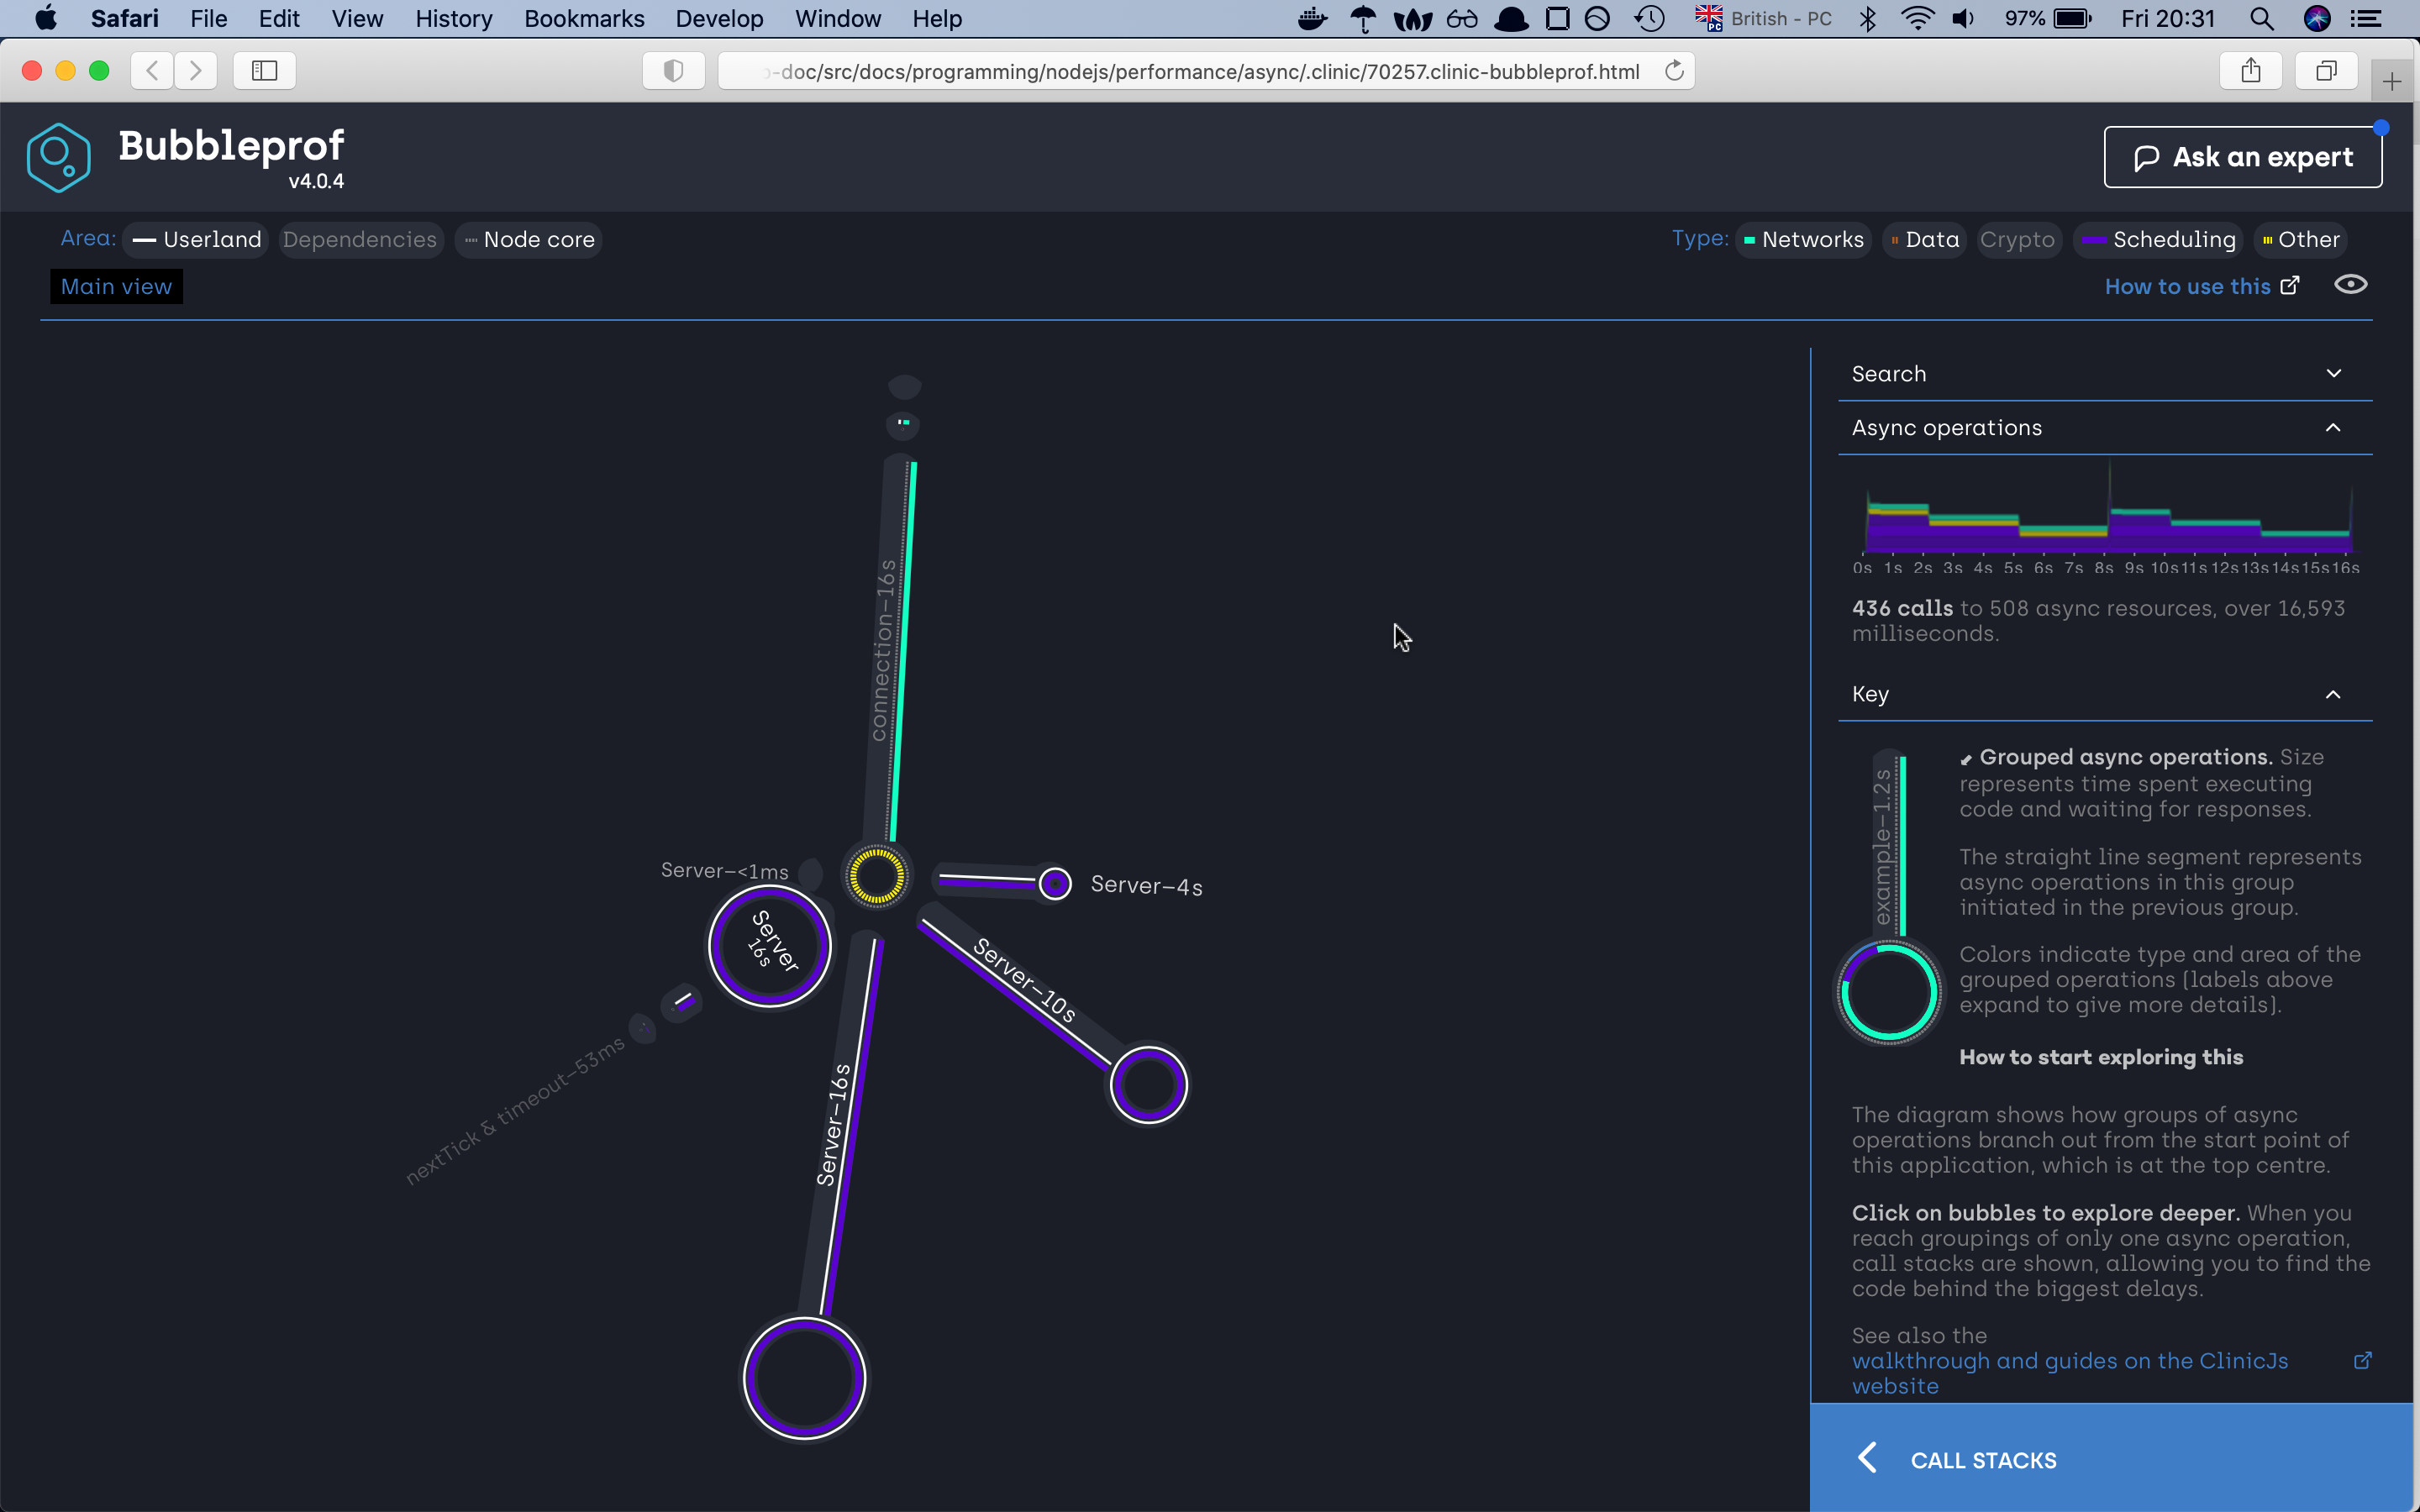
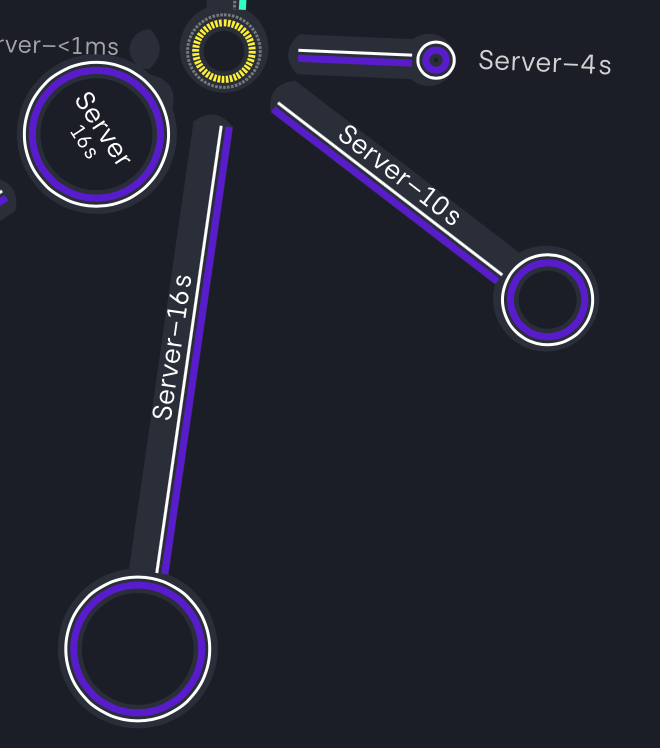

If we check the new server first of all we can already see that we have reduced the time to half. The otherthing
that we can see is that the bubble has changed. Right now we have four bubbles. The one which shows us the total
amount the server needed to complete all the autocannon requests plus the three remaining bubbles. If we look closely
at the bubbles we will find out that those three bubbles represent the total amount of time needed to finish all requests
for one specific async operation. In our autocannon configuration we have set up to have 10 connection to the server and
we required 20 requests to finish. So from our server-side our first promisewaitOld(2000) needed 4s to finish all required requests,
the second waitOld(5000) needed 10s, the third waitOld(5000) needed 16s and altogether it took 16 seconds to complete all 20 requests for 10 connection.
The end
And with this, we are finishing with our article. The article is quite long there is a lot of stuff that we didn’t go ower
that’s is why I encourage you to check the clinicjs website where you can check they’re examples.
And with this, i finish with my last tip taken from the nodejs documentation
Here’s a good rule of thumb for keeping your Node.js server speedy: Node.js is fast when the work associated with each client at any given time is “small”.
Acknowledgment
A would like to thank Ajeh Emeke and Maks Majer for giving me advice on how to improve the content.