This is a post on some basic tools for debugging, measuring performance and monitoring our nodejs applications.
In the first part, we will look into the most basic way of logging and debugging
our app including that we will take a small pick into measuring our nodejs performance.
In the second part, we will take more time and go into the depth of how to debug our app with
CPU, Memory, and I/O problems.
So let’s get started 😊.
Logging
When developing our application a lot of time we want to see data of our application over time like checking the state of a variable
on line 34 or the data present on our request server, for that we need to log our data in this case if you come from the front-end word
you can use the helper function console.log which enables you to show data of the application in the console. If you work with nodejs
you can be lucky because the same functionality is present in nodejs.
**To know: ** in the background
console.logcalls theprocess.stdout.writemethodconst console = { log: args => process.stdout.write(args), };
this approach is quite handy if you have to debug something fast. But for a more complex project, I would recommend you to use the build-in module util.debuglog.
Compare to the console.log method the module allows us to organize our logs by categories which makes debugging easier especially if you have to debug a specific
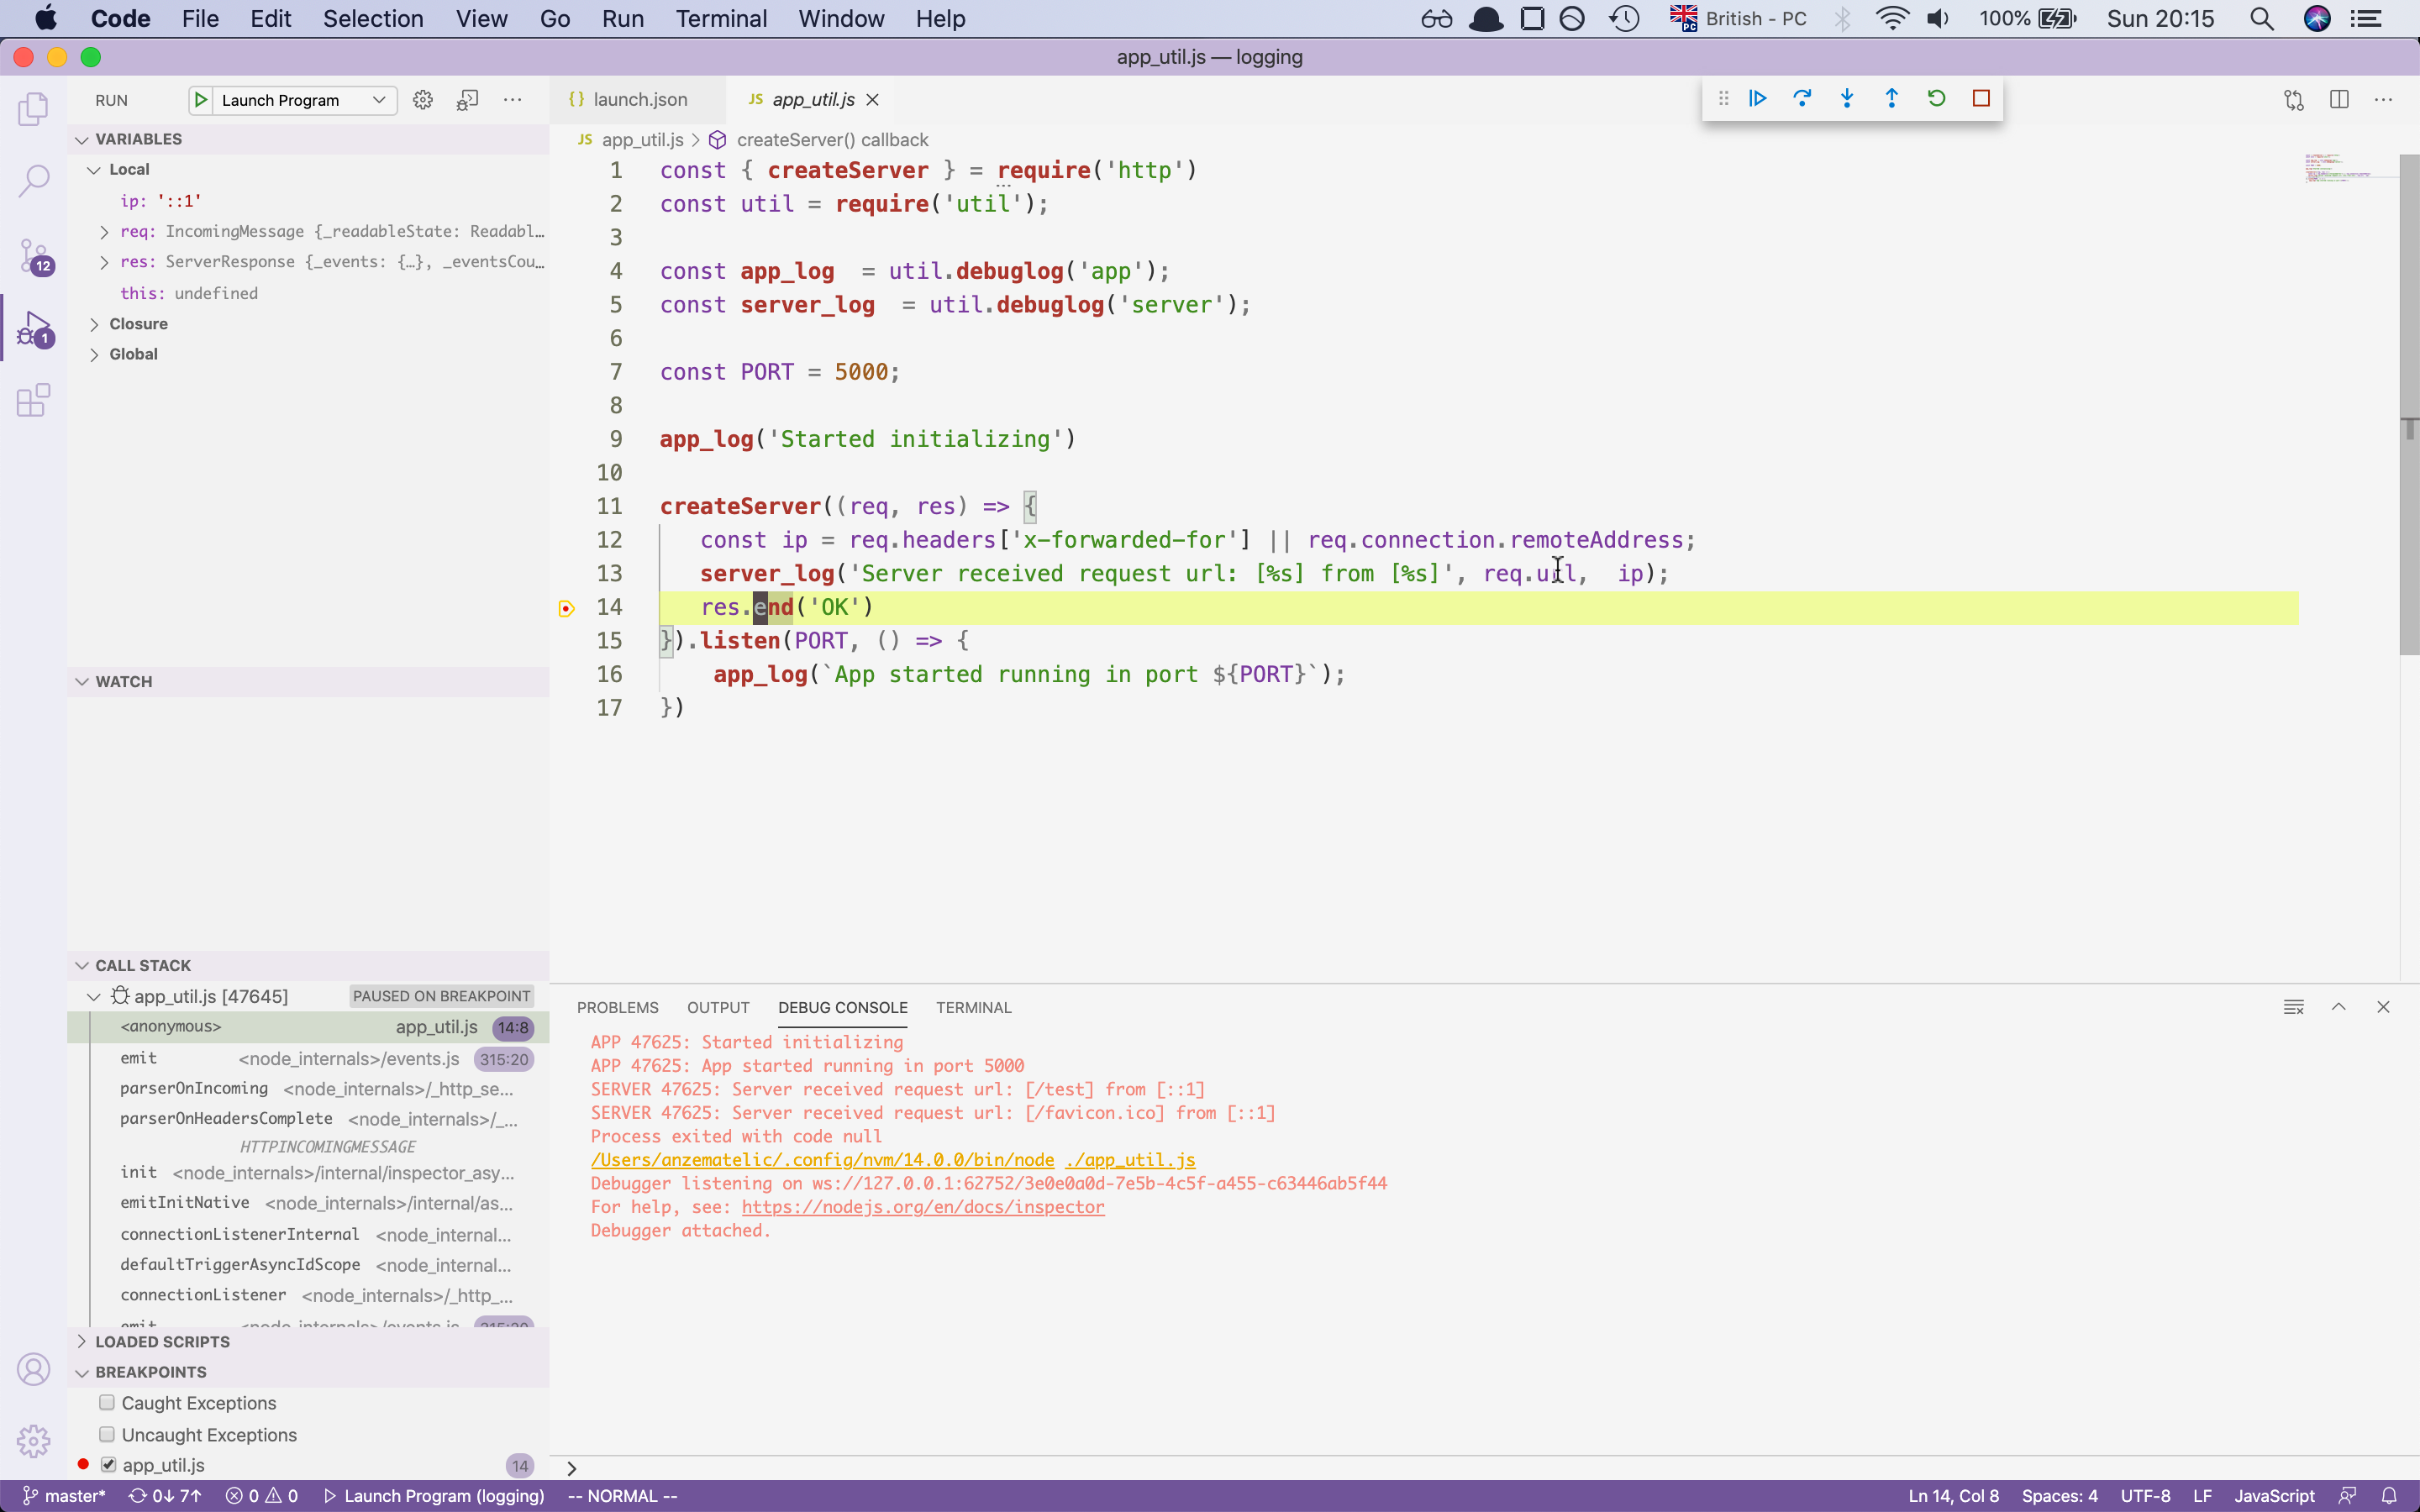
part of your application, but better than writing about this let’s show a basic example. In the below example we are creating two instances of our logger. The first
debuglogs purpose is to logout information related to the app and the other one is used for login basic data, metrics related to the server that is running
Important note if we want to see the logs we need to provide the enviroment vairiable with the name of the debuging name EXAMPLE:
NODE_DEBUG=app,server node ./app.jsin case you are using fish shell like me then you need to run your code like thisenv NODE_DEBUG=app,server node ./app.js
const { createServer } = require("http");
const util = require("util");
// Deffining loggers for app and server
const app_log = util.debuglog("app"); // initializing app logger
const server_log = util.debuglog("server"); // initializing server logger

const PORT = 5000;

app_log("Started initializing");

createServer((req, res) => {
  const ip = req.headers["x-forwarded-for"] || req.connection.remoteAddress;
  server_log("Server received request url: [%s] from [%s]", req.url, ip); // loggin data related to request
  res.end("OK");
}).listen(PORT, () => {
  app_log(`App started running in port ${PORT}`);
});
Example of output:

As you can see for the app we are showing the information if the app has started and if the initialization of the server was successful
in the case of the server we are just login every request that is made to the server. As you can see this is quite a basic logging module
but compare to the previous solution, it helps us to narrow down the information that we want to see rather than have everything output on
the screen.But this is only one solution especially if you don’t want to include an extra dependency to your project. In that case i would
recommend you to use a third party libary which, includes even more functionality, like support for different ways of storing the logs like
in a file or database, support for different login types like info, debug, error, alert and many more.
For a list of that kind of modules you can check the list below:
Logging modules
My recomendation for choosing one would be pino just that you know 😊.
Debugging
when working with a more complicated application, you will find out fast that logging data is not always the optimal way to debug stuff.
That’s why most programming languages have a debugger functionality
The debugger is s functionality that helps us to stop the execution of our program in a specific point of time. We set up a breakpoint in a specific line of
the code and we wait for the code where we set up our breakpoint to execute. After the code hits the specific breakpoint, we can see the whole call stack of our app.
important Since the debugger has full access to the Node.js execution environment, a malicious actor is able to execute arbitrary code on behalf of the Node.js process. It is important to understand the security implications of exposing the debugger port on public and private networks. more on this from nodejs page
Now that we know what a debugger is let’s try to access it. Like in the prev section we will again try to show the debugger first from a frontend perspective, because the same debugger which is used on the frontend can be used in nodejs too.
Chrome debugger
For debugging a website we start with opening our chrome browser and pressing Command+Option+C (Mac) or Control+Shift+C.
Now that we have our console open. Let’s add a break and for that let’s check the video below how to do it.
👇
As you can see the process is quite simple. Now that we know how to use the debugger in chrome let’s add a
debugger to our nodejs application. But don’t worry the process is quite easy, for adding the debugger to our
nodejs app we have to only add the --inspect flag to our app
node --inspect ./app_util.js
with that, we are telling our nodejs application to attach a debugger to our running app. For accessing the debugger for node we have to then open the chrome browser and go to the Chrome inspect page. as you can see we have the same UI as before with which we can finally debug our app.
this is the most simples way to debug a node application, but if you are working with and text editor then there is a
possibility that your editor already supports a debugger. In our case, we will show how to access a debugger in VScode.
VScode
vscode is a code editor which was written in javascript/typescript, the editor supports running a debugger without problems. For how to run the debugger check the video below.
👇
with this, we have set up our debugger with the help of vscode which should make debugging easier.
If you are using another text editor there is some possibility that the editor is supported.
For more information check out this site.
Debugging Guide
Measuring webserver performance with autocannon
- AutoCannon used for http/https benchmarking. (Part 1)
- used for measuring http/https performance
- Clinicjs used for measuring nodejs apps (Part 2)
- Doctor used for measuring I/O, cpu, memory, event loop
- Flame measures the amount of time a function was on CPU
- Bubbleprof measures everything related to async work
Now that we went over the debugging and logging section we can finally check the intro for measuring performance.
For this part, we will create an application where we will check how much traffic our app can handle.
For this tool we will take a look at the module AutoCannon. So run the below command to install the module globaly
npm i autocannon -g
and let’s start.
AutoCannon
AutoCannon as mentioned before is HTTP/1.1 benchmarking tool. With the help of autocannon we can test our server on how much traffic it can serve. In our first example we will make a basic server that will get some data from our mock db and return it to the client.
Slow code
const { createServer } = require("http");
const { DbMock } = require("./util");

const PORT = 8888;

const db = new DbMock();
let count = 0;

createServer(async (_, res) => {
  let key = count % 10;
  const content = await db.getById(key);
  return res.end(content);
}).listen(PORT, () => {
  console.log(`Server listening: ${PORT}`);
});
now that we have written our server let’s run the autocannon command. Including with autocannon we will include the
flag -c which is the number of clients connected to the server and the flag -d for how long the test should last.
For the finish, we will use the --on-port flag which will tell autocannon to wait for execution until our nodejs app is running
npx autocannon -c 200 -d 10 --on-port / -- node ./slow-server.js
with this command executed we should now get a table which tells us the performance of our app with the provided configuration
Server listening: 8888
Running 10s test @ http://localhost:8888/
200 connections

┌─────────┬─────────┬─────────┬─────────┬─────────┬───────────┬──────────┬────────────┐
│ Stat    │ 2.5%    │ 50%     │ 97.5%   │ 99%     │ Avg       │ Stdev    │ Max        │
├─────────┼─────────┼─────────┼─────────┼─────────┼───────────┼──────────┼────────────┤
│ Latency │ 1003 ms │ 1012 ms │ 1061 ms │ 1062 ms │ 1016.5 ms │ 16.07 ms │ 1066.27 ms │
└─────────┴─────────┴─────────┴─────────┴─────────┴───────────┴──────────┴────────────┘
┌───────────┬─────┬──────┬─────────┬─────────┬─────────┬─────────┬─────────┐
│ Stat      │ 1%  │ 2.5% │ 50%     │ 97.5%   │ Avg     │ Stdev   │ Min     │
├───────────┼─────┼──────┼─────────┼─────────┼─────────┼─────────┼─────────┤
│ Req/Sec   │ 0   │ 0    │ 200     │ 200     │ 180     │ 60      │ 200     │
├───────────┼─────┼──────┼─────────┼─────────┼─────────┼─────────┼─────────┤
│ Bytes/Sec │ 0 B │ 0 B  │ 22.8 kB │ 22.8 kB │ 20.5 kB │ 6.84 kB │ 22.8 kB │
└───────────┴─────┴──────┴─────────┴─────────┴─────────┴─────────┴─────────┘

Req/Bytes counts sampled once per second.

2k requests in 10.1s, 205 kB read
as you can see the server could handle 2k requests over a period of 10 seconds. That doesn’t sound so bad. But is it possible to make our server even faster and the answer is yes. In our case, we will change the logic of our server and add a cashing layer to the server. Right now our database is taking 1 second for every request, rather than fetching the same request multiple times which is time-consuming. Let’s store them in our cash service, which will take less time to retrieve. Check the code below to see the changes:
Fast server
const { createServer } = require("http");
const { DbMock, CacheService } = require("./util");

const PORT = 8888;

const db = new DbMock();
const cache = new CacheService();
let count = 0;

createServer(async (_, res) => {
  let key = count % 10;
  const value = cache.get(key);

  if (value) {
    return res.end(value);
  }

  const content = await db.getById(key);
  cache.set(key, content);
  return res.end(content);
}).listen(PORT, () => {
  console.log(`Server listening: ${PORT}`);
});
if we now run the code with the same config like before then we should see big changes now.
npx autocannon -c 200 -d 10 --on-port / -- node ./fast-server.js
AutoCannon result
Server listening: 8888
Running 10s test @ http://localhost:8888/
200 connections

┌─────────┬──────┬──────┬───────┬───────┬────────┬──────────┬────────────┐
│ Stat    │ 2.5% │ 50%  │ 97.5% │ 99%   │ Avg    │ Stdev    │ Max        │
├─────────┼──────┼──────┼───────┼───────┼────────┼──────────┼────────────┤
│ Latency │ 4 ms │ 5 ms │ 7 ms  │ 10 ms │ 5.5 ms │ 25.87 ms │ 1073.55 ms │
└─────────┴──────┴──────┴───────┴───────┴────────┴──────────┴────────────┘
┌───────────┬─────┬──────┬─────────┬─────────┬─────────┬──────────┬────────┐
│ Stat      │ 1%  │ 2.5% │ 50%     │ 97.5%   │ Avg     │ Stdev    │ Min    │
├───────────┼─────┼──────┼─────────┼─────────┼─────────┼──────────┼────────┤
│ Req/Sec   │ 0   │ 0    │ 35231   │ 39903   │ 33207.2 │ 11472.76 │ 30735  │
├───────────┼─────┼──────┼─────────┼─────────┼─────────┼──────────┼────────┤
│ Bytes/Sec │ 0 B │ 0 B  │ 4.02 MB │ 4.55 MB │ 3.79 MB │ 1.31 MB  │ 3.5 MB │
└───────────┴─────┴──────┴─────────┴─────────┴─────────┴──────────┴────────┘

Req/Bytes counts sampled once per second.

332k requests in 10.09s, 37.9 MB read
as you can see our server has improved quite a lot we went from 2k request to 332k request. Quite a performance increase.
autocannon is perfect for this kind of jobs where we went to benchmark our services and see what they can handle but that is
not everything we can use for improving our service, in the next part we will look into clinicjs with which we will investiga
problem with memory, cpu usage the event loop and async tasks.